The Hardest Water in the US: Cities and States, Ranked
Across the 606 public water systems serving 50,000+ people with measured hardness values — one city per system, because neighboring towns on the same utility drink the same water — San Buenaventura (Ventura), CA has the hardest water at 505.0 mg/L (29.5 gpg) — very hard on the USGS scale — while Harrison, NY has the softest at 6.2 mg/L. By population-weighted median, North Dakota is the hardest-water state in the country.
Data updated September 13, 2026. Source: utility-reported water quality data, verified as documented in our methodology. By TapWaterData Editorial.
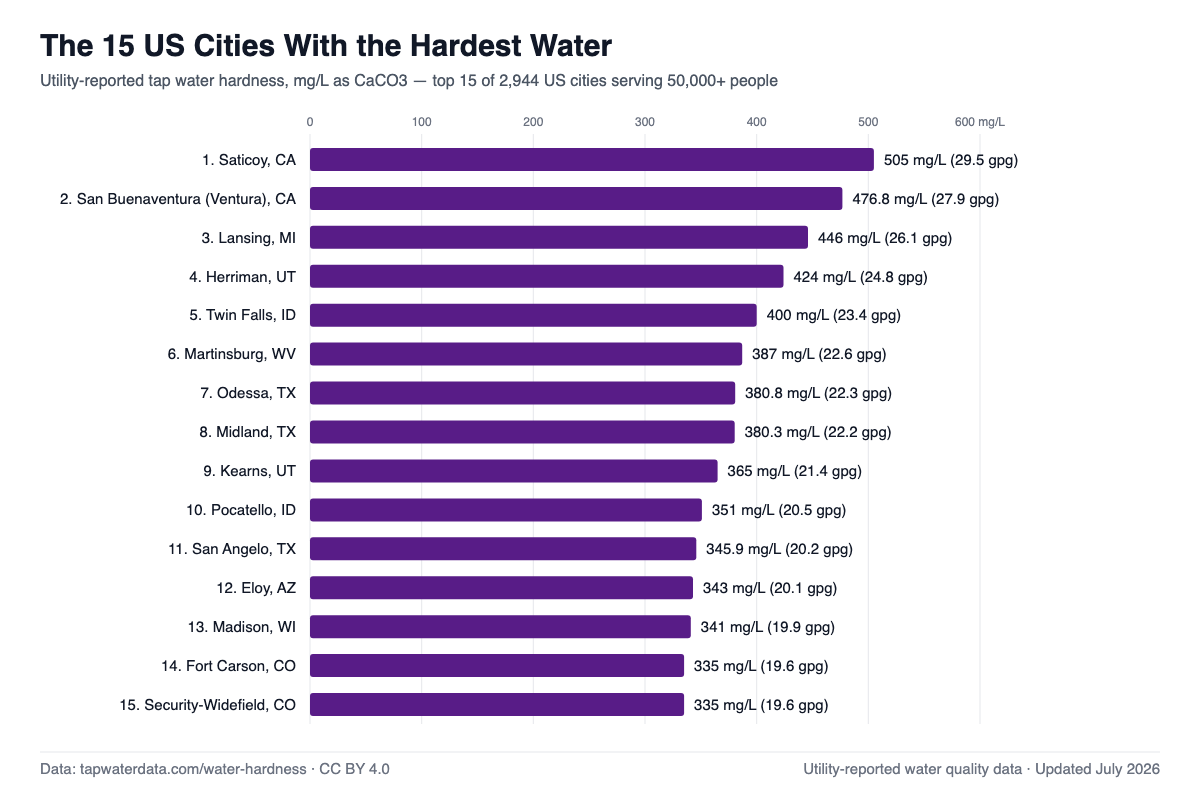
The 25 US Cities With the Hardest Water
Measured values only (utility-reported, or computed from utility-reported calcium and magnesium), cities serving at least 50,000 people.
| # | City | State | Hardness (mg/L) | gpg | Category | Population served | Data |
|---|---|---|---|---|---|---|---|
| 1 | San Buenaventura (Ventura) | CA | 505.0 | 29.5 | Very hard | 113,500 | Utility-reported |
| 2 | Herriman | UT | 424.0 | 24.8 | Very hard | 58,858 | Utility-reported |
| 3 | Twin Falls | ID | 400.0 | 23.4 | Very hard | 50,197 | Utility-reported |
| 4 | Midland | TX | 381.0 | 22.3 | Very hard | 142,344 | Utility-reported |
| 5 | Odessa | TX | 381.0 | 22.3 | Very hard | 123,334 | Utility-reported |
| 6 | Kearns | UT | 365.0 | 21.4 | Very hard | 55,119 | Utility-reported |
| 7 | Pocatello | ID | 351.0 | 20.5 | Very hard | 56,732 | Utility-reported |
| 8 | Madison | WI | 341.0 | 19.9 | Very hard | 272,000 | Utility-reported |
| 9 | Anaheim | CA | 329.0 | 19.2 | Very hard | 341,245 | Utility-reported |
| 10 | Rockford | IL | 329.0 | 19.2 | Very hard | 147,051 | Utility-reported |
| 11 | Casper | WY | 327.0 | 19.1 | Very hard | 59,000 | Utility-reported |
| 12 | Waukesha | WI | 325.0 | 19.0 | Very hard | 70,718 | Utility-reported |
| 13 | Kalamazoo | MI | 319.0 | 18.6 | Very hard | 192,992 | Utility-reported |
| 14 | Henderson | NV | 304.0 | 17.8 | Very hard | 321,781 | Utility-reported |
| 15 | Kansas City | KS | 303.0 | 17.7 | Very hard | 152,960 | Utility-reported |
| 16 | Tinley Park | IL | 300.0 | 17.5 | Very hard | 56,703 | Utility-reported |
| 17 | Los Altos | CA | 298.0 | 17.4 | Very hard | 70,175 | Utility-reported |
| 18 | Sunnyvale | CA | 298.0 | 17.4 | Very hard | 155,567 | Utility-reported |
| 19 | La Crosse | WI | 290.0 | 17.0 | Very hard | 53,000 | Utility-reported |
| 20 | Bonita | CA | 289.0 | 16.9 | Very hard | 226,413 | Utility-reported |
| 21 | Spring Valley | NV | 285.0 | 16.7 | Very hard | 1,502,604 | Utility-reported |
| 22 | Garden Grove | CA | 283.0 | 16.6 | Very hard | 174,226 | Utility-reported |
| 23 | Peoria | IL | 283.0 | 16.6 | Very hard | 121,478 | Utility-reported |
| 24 | Charter Oak | CA | 275.0 | 16.1 | Very hard | 56,336 | Utility-reported |
| 25 | Downey | CA | 255.0 | 14.9 | Very hard | 111,269 | Utility-reported |
The 25 US Cities With the Softest Water
Same rules, other end of the scale — large US cities where tap water is softest.
| # | City | State | Hardness (mg/L) | gpg | Category | Population served | Data |
|---|---|---|---|---|---|---|---|
| 1 | Harrison | NY | 6.2 | 0.4 | Soft | 59,629 | Utility-reported |
| 2 | Gorham | ME | 8.0 | 0.5 | Soft | 142,000 | Utility-reported |
| 3 | Fall River | MA | 8.3 | 0.5 | Soft | 94,000 | Utility-reported |
| 4 | Greenville | SC | 8.4 | 0.5 | Soft | 394,840 | Utility-reported |
| 5 | Asheville | NC | 9.2 | 0.5 | Soft | 156,720 | Utility-reported |
| 6 | Fresno | CA | 9.6 | 0.6 | Soft | 1,095,213 | Computed from Ca+Mg |
| 7 | Chicopee | MA | 9.6 | 0.6 | Soft | 55,126 | Utility-reported |
| 8 | College Station | TX | 10.0 | 0.6 | Soft | 104,103 | Utility-reported |
| 9 | Stockton | CA | 10.2 | 0.6 | Soft | 183,046 | Computed from Ca+Mg |
| 10 | Springfield | MA | 10.5 | 0.6 | Soft | 169,071 | Utility-reported |
| 11 | New Chapel Hill | TX | 10.6 | 0.6 | Soft | 61,662 | Utility-reported |
| 12 | Hanford | CA | 11.0 | 0.6 | Soft | 62,127 | Utility-reported |
| 13 | Granite Bay | CA | 11.3 | 0.7 | Soft | 89,008 | Utility-reported |
| 14 | Bryan | TX | 11.9 | 0.7 | Soft | 87,816 | Utility-reported |
| 15 | Suffolk | VA | 11.9 | 0.7 | Soft | 69,822 | Utility-reported |
| 16 | Plantation | FL | 12.2 | 0.7 | Soft | 85,496 | Utility-reported |
| 17 | Sunrise | FL | 12.6 | 0.7 | Soft | 79,550 | Utility-reported |
| 18 | Alderwood Manor | WA | 12.6 | 0.7 | Soft | 197,993 | Utility-reported |
| 19 | Cameron Park | CA | 14.3 | 0.8 | Soft | 130,687 | Utility-reported |
| 20 | Dunthorpe | OR | 14.3 | 0.8 | Soft | 614,059 | Utility-reported |
| 21 | Falmouth | MA | 14.8 | 0.9 | Soft | 97,551 | Utility-reported |
| 22 | Waltham | MA | 15.0 | 0.9 | Soft | 65,218 | Utility-reported |
| 23 | Gainesville | GA | 15.3 | 0.9 | Soft | 140,000 | Utility-reported |
| 24 | Spartanburg | SC | 15.6 | 0.9 | Soft | 140,024 | Utility-reported |
| 25 | Bloomfield | CT | 15.9 | 0.9 | Soft | 390,887 | Utility-reported |
How This Ranking Works
- Measured tiers only: every ranked value is utility-reported hardness or hardness computed from utility-reported calcium and magnesium. Labeled county-level estimates never enter a city ranking.
- Disputed values excluded: cities whose reported tap values conflict beyond tolerance are flagged disputed and left out of the rankings entirely.
- Population floor of 50,000: rankings compare cities where the recorded utility serves at least 50,000 people, per our index. Where a known city-to-utility mis-mapping would otherwise drop a major city — Chicago and Las Vegas among them — we publish a cited, hand-verified correction so the city is represented by its real supply rather than excluded or guessed.
- One city per water system: hardness is a property of the supply, so every town a regional utility serves reports the same value. Each system appears once, represented by the largest community it serves — otherwise a single utility could fill most of a table. The state pages and the dataset still list every city.
Full sourcing, tier definitions, tolerances, and verification rules: data & methodology.
States With the Hardest Water
Each state's number is the population-weighted median across every covered city in the state — including labeled county-level estimates (T3) — so states are compared on their full coverage, not just the cities with utility-reported values. "County estimates" counts how many of the state's cities carry an estimate rather than a measured value.
| # | State | Median (mg/L) | Median (gpg) | Cities in median | County estimates |
|---|---|---|---|---|---|
| 1 | North Dakota | 320.0 | 18.7 | 100 | 97 |
| 2 | Iowa | 296.0 | 17.3 | 386 | 370 |
| 3 | Nevada | 280.0 | 16.4 | 47 | 23 |
| 4 | Utah | 231.0 | 13.5 | 170 | 127 |
| 5 | Illinois | 229.0 | 13.4 | 639 | 483 |
| 6 | Nebraska | 215.0 | 12.6 | 195 | 189 |
| 7 | New Jersey | 210.0 | 12.3 | 419 | 251 |
| 8 | Indiana | 186.0 | 10.9 | 377 | 358 |
| 9 | Arizona | 180.0 | 10.5 | 135 | 108 |
| 10 | Texas | 180.0 | 10.5 | 1,208 | 346 |
States With the Softest Water
| # | State | Median (mg/L) | Median (gpg) | Cities in median | County estimates |
|---|---|---|---|---|---|
| 1 | Maine | 8.0 | 0.5 | 118 | 55 |
| 2 | Georgia | 17.6 | 1.0 | 361 | 299 |
| 3 | New Hampshire | 19.7 | 1.2 | 89 | 84 |
| 4 | South Carolina | 22.0 | 1.3 | 195 | 176 |
| 5 | Oregon | 22.6 | 1.3 | 219 | 180 |
| 6 | Mississippi | 24.0 | 1.4 | 268 | 265 |
| 7 | North Carolina | 28.0 | 1.6 | 470 | 435 |
| 8 | Massachusetts | 28.8 | 1.7 | 316 | 117 |
| 9 | Washington | 30.9 | 1.8 | 371 | 180 |
| 10 | Arkansas | 37.9 | 2.2 | 374 | 248 |
Want the regional picture city by city? See the interactive hardness map or start from the water hardness hub.
Cite this data
These rankings — and the full city-level dataset behind them — are free to republish under Creative Commons Attribution 4.0 (CC BY 4.0): credit TapWaterData with a link. Suggested citation:
TapWaterData Water Hardness Dataset, 2026. https://www.tapwaterdata.com/water-hardness — CC BY 4.0
Download the full dataset (CSV and JSON): open dataset. How every value is sourced and verified: methodology.
Water hardness tools
By TapWaterData Editorial.
Get the Weekly Water Brief
One email a week on water testing, treatment, and what water-quality data means for your home.
One email a week. Unsubscribe anytime.