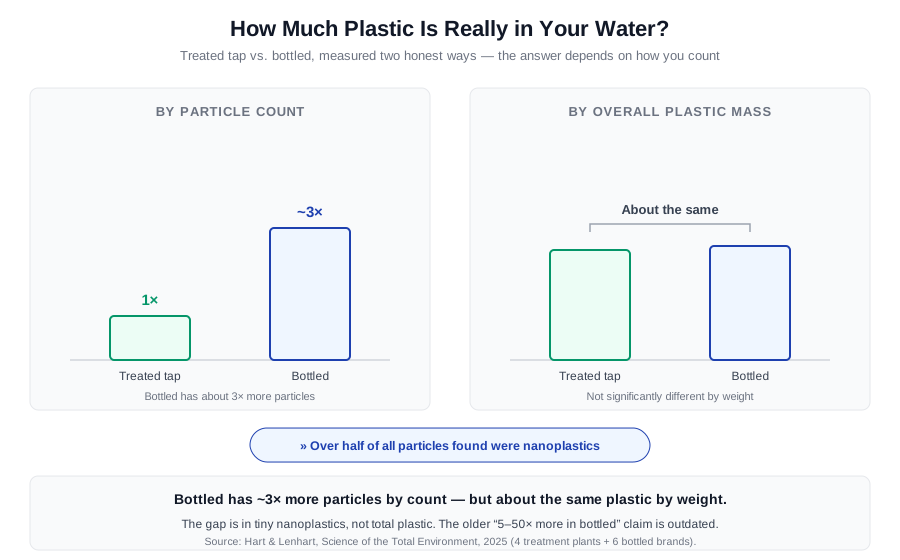
Yes — treated tap water contains micro- and nanoplastics, and so does bottled, which ran about 3× higher by particle count in the newest paired study (Hart & Lenhart, Science of the Total Environment, 2025). That study sampled four Lake Erie–area treatment plants and six bottled brands and found plastic particles in both, spanning 300 nanometers to 42.3 microns, with more than half of all particles being nanoplastics. So the premise of the question is settled: the plastics are there. The harder, more useful questions — how much, whether it matters for your health, and what you can actually do — are where most articles either hand-wave or fear-sell. This one answers them with the numbers we can pin down and flags the ones we can't.
Here's why the "how much" is genuinely uncertain rather than hidden: the count depends on how small a particle your instrument can see. Shrink the detection threshold and the tally climbs — a Columbia study counted roughly 240,000 nanoplastic particles per liter in bottled water once it looked down to 100 nanometers (Qian et al., PNAS, 2024). That's why we won't publish a single "particles per liter" number for your tap: any such figure is method-dependent, and the old viral framings ("6 million particles" or "24× more in bottled") don't hold up against the newer paired data.
This guide covers how much plastic is really in tap water, why the numbers disagree, what the health evidence does and doesn't show, why it's absent from your water report, how to test for it, and which filters actually remove it. If you'd rather start local, look up your city's water and most recent report; if you already know you want it out, jump to how to pick a filter that removes microplastics.
Key takeaways
- Tap water contains microplastics — bottled runs ~3× higher by count. The newest paired study found bottled water carried about three times as many particles as treated tap water, with more than half being nanoplastics (Hart & Lenhart, 2025).
- The "how much" is method-dependent, so treat single per-liter numbers with suspicion. Counts rise as detection thresholds fall; a finer 100-nanometer threshold found ~240,000 nanoplastic particles per liter in bottled water (Qian et al., 2024).
- The health evidence is association, not causation. People with micro- and nanoplastics in arterial plaque had a ~4.5× higher rate of cardiovascular events over ~34 months (Marfella et al., NEJM, 2024) — paired with the WHO's view of "low concern at current levels" (WHO, 2019).
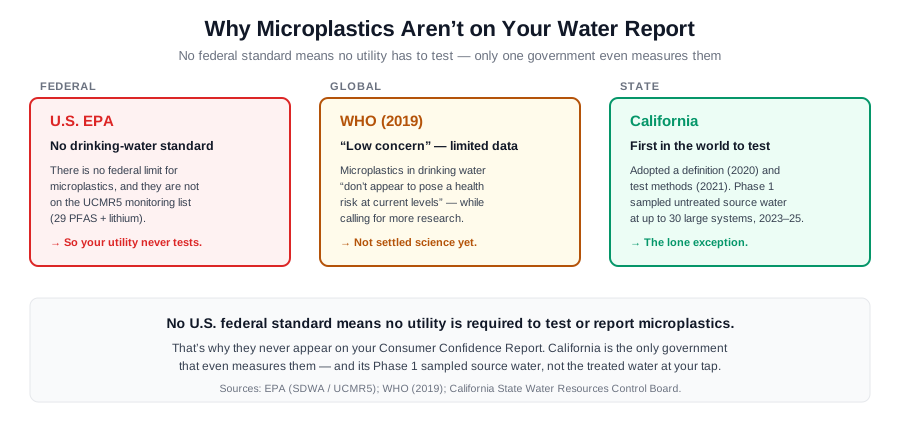
- It's not on your report because there's no federal standard. The EPA sets no limit and doesn't require monitoring; California is the first government in the world to require testing (California State Water Board, 2020).
- Reverse osmosis removes essentially all of it. An RO membrane (~0.0001 micron) is thousands of times smaller than the smallest microplastic, so it removes >99%; certified microplastics reduction falls under NSF/ANSI 401 (NSF).
See what's actually reported for your water → Look up your city's latest results — microplastics won't be on there, and this guide explains exactly why.
You might be wondering whether this is the setup for a filter pitch dressed as science. It isn't. TapWaterData earns affiliate commission only on filters, and the most honest read of the evidence — the WHO calling microplastics low concern at current levels while the strongest human data remain associations — argues against urgency for most households, not for it. Whether a filter is worth it depends on what you value and what's in your specific water, not on what's in our catalog. We link to our filter guide for people who decide it's worth it, and we tell everyone else, plainly, that "the WHO says low concern" is a legitimate reason to do nothing.
How much plastic is actually in tap water?
The most rigorous recent look paired tap and bottled directly. Researchers sampled four drinking-water treatment plants near Lake Erie and six bottled-water brands, then analyzed the samples with scanning electron microscopy and optical photothermal infrared spectroscopy (Hart & Lenhart, 2025). Both tap and bottled contained micro- and nanoplastics across a 300-nanometer to 42.3-micron range. Bottled water carried about 3× as many particles as treated tap water by count, and more than half of all particles detected — in both — were nanoplastics, the sub-micron fraction too small to see under an ordinary microscope.
Two nuances keep this honest. First, the ~3× gap is a count difference, driven largely by those tiny nanoplastics, not necessarily a difference in overall plastic mass, which the reporting describes as roughly comparable. Second, it's brand-dependent: some bottled brands overlapped with or exceeded tap, so "bottled is always far worse" overstates it (Hart & Lenhart, 2025). If you've internalized the old "bottled has 5 to 50 times more plastic" line, this is the correction — the honest multiple is about three, and it's about particle count.
Where do the plastics in treated tap water come from? That part is still unresolved. The plausible candidates are the source water itself, materials used in treatment, and the plastic components of the distribution pipes that carry water to your tap (Hart & Lenhart, 2025). No single source has been isolated, which is one more reason to hold the "how much" loosely rather than quote a precise figure.
Why do the numbers disagree so much?
If you've seen wildly different microplastic counts — hundreds here, hundreds of thousands there — the reason is not that someone is lying. It's that the count depends almost entirely on how small a particle the instrument can detect. Set the detection floor at a micron and you count one population of particles; drop it to 100 nanometers and a much larger population of nanoplastics comes into view. In the Columbia study that pushed the threshold down to 100 nanometers, bottled water registered roughly 240,000 nanoplastic particles per liter — orders of magnitude above older estimates, not because the water changed but because the ruler did (Qian et al., 2024).
That method-dependence is why we deliberately don't publish a single "particles per liter" figure for your tap. The viral numbers you may remember — a figure in the millions, or a "24× more in bottled" multiple — come from mixing incompatible methods and don't survive the newer paired analysis. A responsible number has to travel with its detection threshold attached, and most headline figures drop that detail.
The practical upshot: judge a microplastics claim by whether it names its method and threshold. "Bottled ran about 3× tap by count, measured 300 nanometers and up, with >50% nanoplastics" (Hart & Lenhart, 2025) is a usable statement because you can see how it was measured. "Your water has X million particles" usually isn't, because you can't.
Are microplastics in tap water actually dangerous?
Here the gap between the public conversation and the evidence is wide, so precise language matters. The anchor position is the WHO's: based on the limited data available, "microplastics in drinking water don't appear to pose a health risk at current levels," alongside a call for better measurement methods and more research (WHO, 2019). That is neither dismissal nor alarm — it's a calibrated "low concern, keep studying."
The most-cited human finding is an association, not proof of harm. In a single cohort followed for about 34 months, patients who had micro- and nanoplastics detected in their carotid-artery plaque had roughly a 4.5× higher rate of heart attack, stroke, or death than those who didn't (Marfella et al., NEJM, 2024). That is a striking signal and worth taking seriously — but an observed association in one group of already-ill patients cannot, on its own, establish that microplastics caused the events. Confounding factors, reverse causation, and the limits of a single cohort all apply. A separate 2025 study documented microplastics accumulating in human brain tissue (Nihart et al., Nature Medicine, 2025); it shows the particles get there, not that they cause harm.
So the calibrated read is: the particles are real and turn up in human tissue; the strongest health data are associations that justify continued research, not a health emergency; and the WHO's "low concern at current levels" remains the responsible baseline (WHO, 2019). If you're deciding what to do, that combination is a legitimate reason to filter if you want the certainty and an equally legitimate reason to do nothing while the science matures. It is not a reason to panic.
Why isn't this on my water quality report?
The short answer is that no federal rule requires it. The EPA has set no maximum contaminant level for microplastics, and microplastics are not on the fifth Unregulated Contaminant Monitoring Rule list — UCMR5 covers 29 PFAS compounds plus lithium, not plastics (EPA, UCMR5). No federal testing or reporting mandate means nothing flows onto the annual Consumer Confidence Report your utility mails you. Your report can be entirely accurate and complete and still say nothing about microplastics, because there's nothing to report against.
California is the exception, and it's a notable one: it became the first US state — and the first government anywhere in the world — to require microplastics testing in drinking water. The state adopted a formal definition in June 2020, released standardized measurement methods (Raman and infrared spectroscopy) in September 2021, and adopted a policy handbook in September 2022 (California State Water Board). Its Phase 1 monitoring measured untreated source water at up to 30 large systems serving more than 100,000 people each, running from Fall 2023 through 2025; monitoring of treated drinking water is planned to follow (California State Water Board; as of 2026-07-10). Several other states have since passed related legislation.
If you want to understand why a real contaminant can be absent from an official report, this is the cleanest example on the board. A number only appears on your CCR when a rule requires the utility to measure it — the difference between a legal limit and a health goal is the concept underneath all of this, and it's worth reading how MCL and MCLG differ and who actually regulates your drinking water to see how a contaminant moves from "studied" to "regulated."
How do I test my water for microplastics?
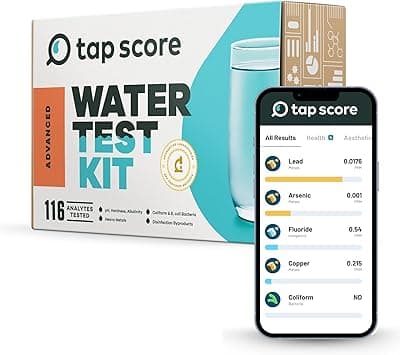
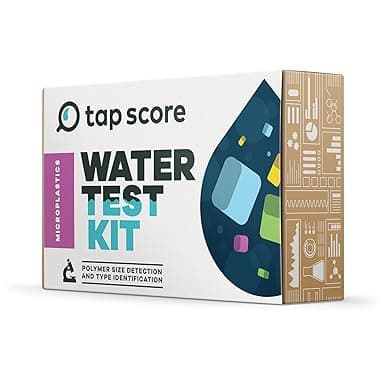
Because microplastics aren't regulated, they aren't on standard lab panels either — a general water test won't touch them. What exists instead is a specialty mail-in microplastics kit from labs like Tap Score (which runs on the SimpleLab certified-lab network). The test reports presence or absence of particles in roughly the 1–10 micron range and quantifies down to about 10 microns, with a higher "Advanced" tier that adds polymer identification so you learn not just that plastic is present but which kind. It's for drinking water specifically, and turnaround runs about one to two weeks (mytapscore.com, as of 2026-07-10). Prices drift, so check the product page before you order.
Two honest caveats before you spend the money. First, because there's no EPA limit, the result is descriptive, not pass/fail — it tells you what's there, not whether you're over a legal line, because no legal line exists. Second, microplastics sampling is unusually easy to contaminate: your own plastic containers, and even the fibers off your clothes, can inflate a reading, which is why the kits ship their own vials and strict collection instructions. Follow them to the letter or the number you get back is measuring your kitchen, not your tap.
- If you're simply curious what's in your water, the standard presence/absence tier answers the question at the lowest cost.
- If you're deciding whether to buy a specific filter, the polymer-ID tier gives you a baseline you can retest against after installation to confirm the filter is doing something.
- If you're on a private well or a specific local concern, the same specialty kit applies — microplastics testing is source-agnostic, so find a certified testing path near you and add the microplastics panel to whatever else you're checking.
Which filters actually remove them?
Filtration works, and the physics is straightforward: the question is whether the filter's pore size is smaller than the plastic particle. Reverse osmosis wins decisively — an RO membrane has a pore size around 0.0001 micron, thousands of times smaller than the smallest microplastic, so a well-maintained RO system removes essentially all of them (>99%). A sub-micron carbon-block or hollow-fiber filter (roughly 0.5–1 micron) captures nearly all microplastics as well. Standard loose-media pitcher filters are the unreliable category — they may catch larger particles but let the smallest ones through — and boiling does nothing, since heat doesn't remove a solid particle.
The part filter marketing rarely makes clear is the certification truth. Microplastics reduction can be independently certified — under NSF/ANSI 401, which verifies at least 85% reduction of particles in the 0.5–1 micron range and is tested by bodies like NSF, IAPMO, and WQA (NSF; WC&P, 2022). Two things matter about that standard. It's an "emerging/incidental contaminant" reduction claim, not a health claim — it certifies that the filter physically reduces the particles, not that doing so produces a health benefit; and it is not NSF/ANSI 244, which is a microbiological standard for bacteria, viruses, and cysts, despite some product pages conflating the two.
The catch is scarcity. Very few consumer filters actually carry the NSF/ANSI 401 microplastics claim, so most "removes microplastics" marketing rests on the manufacturer's own in-house testing rather than third-party certification.
So the scenario-based read: if you've decided you want microplastics out with certainty, a reverse-osmosis system or a filter carrying the NSF/ANSI 401 microplastics claim is the defensible choice; if you'd accept "nearly all," a sub-micron carbon block does it at lower cost and without RO's water waste; and if the WHO's "low concern at current levels" satisfies you, no filter is a perfectly reasonable answer. For the type-by-type breakdown, matched products, and what each certification actually promises, our filter guide for microplastics and the microplastics filter data page take it from here.
| Filter type | Typical pore size | Microplastic removal | Independent certification | Best-fit scenario |
|---|---|---|---|---|
| Reverse osmosis (under-sink) | ~0.0001 micron | >99% (essentially all) | Can carry NSF/ANSI 401 | You want certainty and will accept installation + water waste |
| Sub-micron carbon block | ~0.5–1 micron | Nearly all | Can carry NSF/ANSI 401 | You want near-total removal without RO complexity |
| Hollow-fiber membrane | ~0.1–0.5 micron | Nearly all | Sometimes NSF/ANSI 401 | Countertop/gravity setups; no plumbing |
| NSF/ANSI 401 carbon (labeled) | Varies (meets ≥85% at 0.5–1 micron) | ≥85% of 0.5–1 micron particles | Yes — the microplastics claim | You want a third-party-verified number |
| Standard pitcher (loose GAC) | ~5+ micron effective | Larger particles only; unreliable for smallest | No microplastics claim | Taste/chlorine; not a microplastics solution |
| Refrigerator/inline carbon | ~0.5–5 micron | Varies; usually not verified | Rarely NSF/ANSI 401 | Convenience; check the label before relying on it |
| Boiling (not a filter) | N/A | None (particles remain) | N/A | Does not remove microplastics |
| Bottom line | Smaller pore = more removal | RO and sub-micron are reliable; pitchers and boiling are not | NSF/ANSI 401 is the microplastics claim — not 244 | Match the method to how much certainty you want |
Sources: filter pore-size and removal physics from NSF standards and filtration literature; NSF/ANSI 401 microplastics-reduction claim (≥85% reduction, 0.5–1 micron) per NSF and WC&P (2022); NSF/ANSI 244 is a microbiological standard (ANSI/NSF). How we compiled this: our data and methodology.
Decided you want it out? → Compare filters that actually remove microplastics, then see the certified product data.
Reading this from a different angle?
- Comparing your two main options? Read bottled vs. tap water — the ~3× particle-count gap in full context, including where bottled water actually loses.
- Ready to pick a filter? Read which filters actually remove microplastics and see the certified microplastics filter data.
- Confused by why a real contaminant isn't on your report? Read MCL vs. MCLG and who regulates your drinking water.
- Want to test for it? Find a certified testing path near you and add a specialty microplastics panel.
Frequently asked questions
Are microplastics in tap water dangerous? The honest answer is that the evidence is association, not proof. The WHO's 2019 assessment concluded microplastics in drinking water "don't appear to pose a health risk at current levels," while calling for more research (WHO, 2019). Human studies have observed associations — people with micro- and nanoplastics in their arterial plaque had a ~4.5× higher rate of cardiovascular events over about 34 months (Marfella et al., NEJM, 2024) — but an observed association in one cohort cannot by itself establish that microplastics caused the events.
Is tap or bottled water worse for microplastics? By particle count, bottled ran about 3× higher than treated tap water in the newest paired study, with more than half of all particles being nanoplastics (Hart & Lenhart, 2025). The gap is in count, not overall mass, and it's brand-dependent — some bottled brands overlapped or exceeded tap. The older "5–50× more in bottled" figure is outdated.
Does boiling water remove microplastics? No. Microplastics are solid particles that boiling temperatures don't destroy, so boiling alone doesn't remove them. If you want to physically remove microplastics, reverse osmosis or a sub-micron carbon-block filter is the reliable route.
Can I test my tap water for microplastics? Yes, but not through a standard panel or your utility. Microplastics require a specialty mail-in kit (for example, Tap Score by SimpleLab) that reports presence or absence of particles in roughly the 1–10 micron range, with a higher tier that identifies the polymer. Turnaround is about one to two weeks (mytapscore.com, 2026).
Does the EPA regulate microplastics in drinking water? No. There's no federal EPA limit for microplastics, and they aren't on the UCMR5 monitoring list (29 PFAS plus lithium), so utilities don't test or report them — which is why they never appear on your Consumer Confidence Report (EPA). California is the exception: in 2020 it became the first government in the world to require microplastics testing in drinking water (California State Water Board).
Methodology and disclosure
This guide draws on primary and authoritative sources: the WHO's 2019 assessment of microplastics in drinking water; the California State Water Resources Control Board's microplastics program (definition 2020, methods 2021, policy handbook 2022, Phase 1 monitoring 2023–2025); the EPA's UCMR5 rule (29 PFAS plus lithium, no microplastics); NSF/ANSI standards 401 and 244; and four peer-reviewed studies — Hart & Lenhart (Science of the Total Environment, 2025) for the ~3× tap-vs-bottled count, Qian et al. (PNAS, 2024) for nanoplastic method-dependence, Marfella et al. (NEJM, 2024) for the cardiovascular association, and Nihart et al. (Nature Medicine, 2025) for brain-tissue accumulation. All load-bearing figures were verified against these sources on July 10, 2026; where a number couldn't be pinned to a primary source — such as an absolute particles-per-liter count for tap water — it's stated as a range or omitted rather than published as a precise claim. TapWaterData is independent of filter brands, and no manufacturer pays for placement or scoring; this guide contains no affiliate links but links to our Filter Buyer guides, which do contain affiliate links scored by our published methodology, published on our data page.