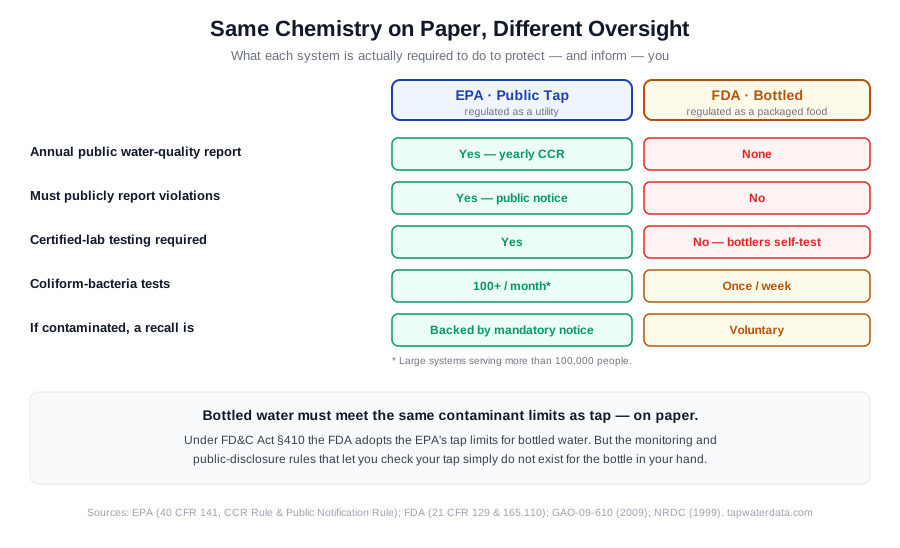
For most US households, bottled water is not safer than tap water — and on the two measures that protect drinkers most, tap is the more rigorously overseen of the two. Big-city tap systems serving more than 100,000 people test for coliform bacteria 100 or more times a month, while bottlers are required to test just once a week (NRDC, 1999; GAO-09-610, 2009). Tap utilities must use state-certified labs, publicly disclose any violation, and mail every customer an annual report; bottlers face none of those three requirements (NRDC, 1999; CDC, 2024). The chemistry limits are broadly similar by law — but the oversight that catches problems is not.
That gap matters because of how much Americans now drink. Bottled water has been the country's #1 beverage by volume for nine straight years, reaching a record 47.3 gallons per person in 2024 — about 12.5 gallons ahead of soda — across 16.4 billion gallons and $50.5 billion in retail sales (Beverage Marketing Corporation / IBWA, 2024 data, 2025). Roughly a quarter to 40% of that volume is purified municipal tap water, the FDA category that includes Aquafina and Dasani, repackaged at hundreds of times the price (NRDC, 1999; Grand View Research, 2024).
This guide compares the two on regulation, cost, microplastics, taste, and the narrow situations where bottled water genuinely earns its place. The fastest way to see what's actually in your own tap is to look up your city and read your utility's most recent tested, publicly reported results.
Key takeaways
- Tap is tested far more often. Big-city tap systems test for coliform 100+ times a month; bottlers test once a week under 21 CFR 129.80 (NRDC, 1999; GAO-09-610, 2009).
- Tap has mandatory transparency; bottled does not. Tap utilities must use certified labs, disclose violations, and send an annual Consumer Confidence Report; bottlers face none of these (CDC, 2024; NRDC, 1999).
- Bottled costs hundreds of times more. Tap runs about $0.003 per gallon; single-serve bottled is roughly $6–10+ per gallon — on the order of hundreds to ~1,000× more (EPA WaterSense, 2024).
- Microplastics: bottled has ~3× the particle count, not "5–50×." Bottled averaged ~6 million particles per liter versus ~3× lower in tap — though tap held more plastic by mass (Hart & Lenhart, 2025).
- Bottled genuinely matters in narrow cases. Boil-water advisories, post-disaster outages, immunocompromised households, and known-unsafe tap are situations where CDC and EPA explicitly recommend bottled or treated water (CDC; EPA).
Look up your city's water → See your utility's source, tested results, and latest report — the same data tap utilities are legally required to publish, and bottlers are not.
You might be wondering whether this is anti-bottled-water content. It isn't. Bottled water is genuinely the right call in several real situations, named at the end of this guide, and "spring," "purified," and "mineral" are honest FDA label categories, not safety rankings. The narrow claim here is the one people most often get backwards: that bottled is more regulated or inherently safer than tap. On monitoring and disclosure, the evidence points the other way.
Who regulates bottled water versus tap water?
The split is clean: the EPA regulates public tap water as a utility under the Safe Drinking Water Act, while the FDA regulates bottled water as a packaged food under the Federal Food, Drug, and Cosmetic Act (CDC, 2024; FDA). They are two different agencies applying two different legal frameworks to two different products.
The two regimes are deliberately linked on chemistry. Under Section 410 of the FD&C Act, each time the EPA sets a drinking-water standard, the FDA must adopt a matching bottled-water standard — or publish reasons it isn't needed — within 180 days, and that standard must be "no less stringent" than the EPA's. If the FDA misses the deadline, the EPA's rule automatically becomes the bottled-water standard (FDA; CDC, 2024; GAO-09-610, 2009). So on paper chemistry, "bottled is held to tap's limits" is broadly fair.
One published limit does differ, for a physical reason. The FDA caps lead in bottled water at 5 ppb, while the EPA's tap figure is a 15 ppb action level — dropping to 10 ppb under the 2024 Lead and Copper Rule Improvements (FDA; EPA, 2024). The tap number is higher not because tap is allowed to be less safe at the source, but because lead leaches from the household pipes and service lines between the treatment plant and your glass — plumbing that doesn't exist on a bottling line.
The practical takeaway: if your only question is "are the chemical limits comparable?", the answer is mostly yes. But chemical limits on paper are not the same as the testing and disclosure that confirm a product actually meets them — which is where the two regimes diverge sharply.
Why isn't bottled water more regulated than tap?
On the dimensions that actually protect drinkers — how often the water is checked and whether problems get disclosed — tap water is the more rigorously overseen of the two (NRDC, 1999; GAO-09-610, 2009). Four specifics carry the point.
Testing frequency. Bottlers are required to test their finished water for coliform bacteria once a week (21 CFR 129.80). A tap system serving more than 100,000 people tests for coliform 100 or more times a month (NRDC, 1999). The difference is roughly an order of magnitude in how quickly a contamination problem would surface.
Certified labs. Tap utilities must use state-certified laboratories for compliance testing; bottlers are not required to, and may self-test (NRDC, 1999; GAO-09-610, 2009). Self-testing isn't inherently unreliable, but it removes the independent check that the tap system is built around.
Violation disclosure. Tap utilities must publicly notify customers of any standard violation under the EPA's Public Notification Rule (40 CFR Part 141, Subpart Q). Bottlers face no mandatory public-violation notice (NRDC, 1999; GAO-09-610, 2009). When something goes wrong on the bottled side, you are unlikely to hear about it through any required channel.
The annual report. Every community tap utility must send customers a Consumer Confidence Report each year, listing detected contaminants and their levels (EPA CCR Rule, 40 CFR §141.151–155; CDC, 2024). There is no CCR-equivalent for bottled water — no required document telling you what's in the bottle. Notably, even the bottled-water industry's own rebuttal to NRDC conceded the weekly-coliform mandate and that a proposed bottled-water right-to-know requirement was defeated (NRDC, 1999).
How much does bottled water cost versus tap?
The cost gap is the least ambiguous part of the comparison, as long as you state the assumptions. Tap water costs about $0.003 per gallon in EPA WaterSense's representative example — roughly three cents for every ten gallons (EPA WaterSense, 2024). That figure is one EPA example rather than a national average; real utilities vary, with some volumetric rates reaching about $0.011 per gallon, so the honest framing is "a fraction of a cent to about a penny per gallon" (EPA WaterSense, 2024).
Bottled water spans a wide range depending on format. Bulk and multipack bottled runs roughly $1.00–1.50 per gallon, about 300–500× tap. Single-serve bottles — the dominant 71% of the category by volume (Beverage Marketing Corporation, 2024 data, 2025) — work out to roughly $6–10+ per gallon-equivalent, putting the multiple in the hundreds to ~1,000× tap range. The exact multiple depends entirely on the bottle price you pay, so treat it as a range, not a fixed number.
Translated to a person drinking one gallon a day, the annual numbers separate clearly. Bottled at that rate runs roughly $365–545 per year per person, while a pitcher filter (Brita Elite, NSF 42/53/401) costs about $30–60 per year — a net difference of roughly $175–515 per year per person (TapWaterData cost analysis; EPA WaterSense, 2024). Over five years, a family of four drinking one gallon each per day would spend an estimated $1,825–2,725 on bottled versus $150–950 on pitcher-filtered tap.
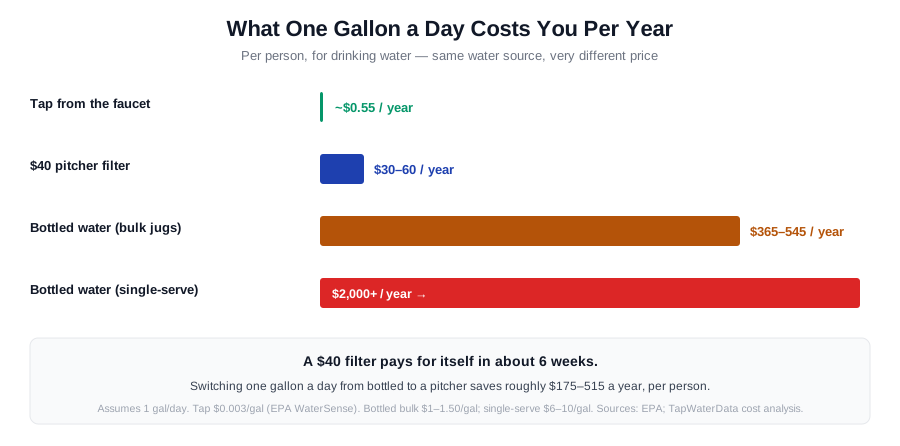
If your tap water meets EPA standards — which you can confirm from your utility's CCR — most of that bottled spend is buying convenience and packaging, not safety. Where the tap has a specific detected problem, the better-value fix is usually a certified filter matched to that contaminant, not a standing bottled-water habit.
Does bottled water have fewer microplastics than tap?
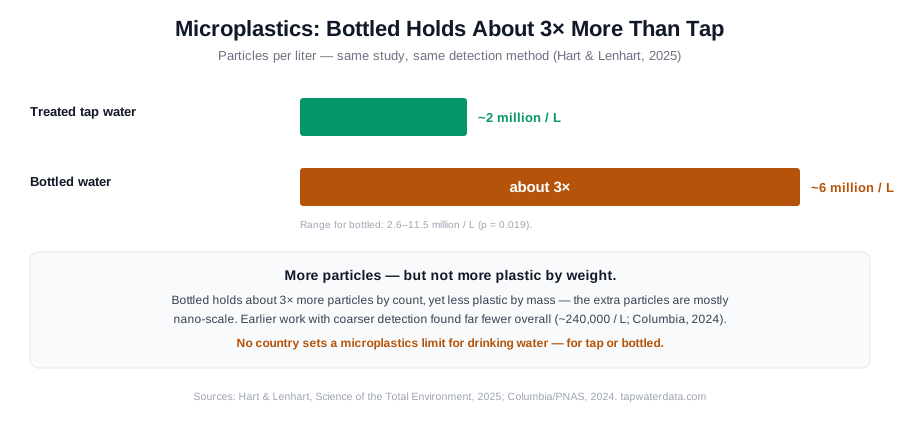
No — recent paired testing found the opposite by particle count, though the picture is more nuanced than the older numbers suggested. Bottled water averaged about 6 million micro- and nanoplastic particles per liter (range 2.6–11.5 million), roughly 3× the count in treated tap water and a statistically significant difference (p=0.019) (Hart & Lenhart, Science of the Total Environment, 2025). The honest multiple is ~3× by count — not the "5–50×" figure that circulated from older, lower-resolution studies.
The mass picture flips, which is why "bottled is categorically worse" overstates it. In that same study, tap water carried more plastic by mass than bottled, because tap held more large microplastics, which weigh far more per particle. Bottled water's signature is the sheer number of tiny nanoplastics rather than total plastic weight (Hart & Lenhart, 2025). Both products contain plastic particles; they differ in particle size distribution more than in a simple "more vs. less."
These counts also depend heavily on detection limits, so the numbers keep climbing as methods improve. A 2024 Columbia University study using finer detection measured about 240,000 particles per liter in bottled water — far higher than earlier estimates simply because it could see smaller particles (Columbia / PNAS, 2024). The health significance is still being worked out: a 2025 study reported an association between microplastics and arterial-plaque tissue (Nihart et al., Nature Medicine, 2025), but causation in drinking water specifically is not established.
The regulatory bottom line is the same for both: no country has a microplastics standard for drinking water, so neither tap nor bottled is tested or limited for them. If reducing particle intake is your goal, switching from bottled to tap lowers the count, and a filter certified under NSF/ANSI 401 addresses microplastics down to its tested particle range.
Can people actually taste the difference?
Most people cannot reliably tell tap from bottled in a blind test. In a controlled blind taste test, neither habitual bottled-water drinkers nor tap-water drinkers could distinguish the two, and the samples didn't systematically differ in ascribed taste or perceived health risk; the authors concluded the perceived differences "seem to reflect illusory beliefs rather than actual experiences" (Debbeler et al., Science of the Total Environment, 2018). That study used a German sample, so treat it as the mechanism, not the final US word.
A US blind test points the same direction. In a 2010 study, only about 36% of participants could correctly distinguish tap from bottled — close to what you'd expect from guessing among the options (Journal of Sensory Studies, 2010). The pattern across studies is consistent: brand and packaging shape the expectation of taste more than the water itself does.
The honest caveat is the word "reliably." Some sensitive tasters can sometimes detect chlorine residual — the disinfectant tap utilities are required to maintain — which is the one cue that gives tap away. If that residual taste is what bothers you, it's also the easiest thing to fix: a basic carbon pitcher, or even letting a pitcher sit uncovered in the fridge for an hour, reduces it at a fraction of bottled water's cost.
So if taste is your reason for buying bottled, the cheaper experiment is to filter your own tap and run a blind test at home. For most households the difference that survives a blind comparison is small enough that it doesn't justify a multiple of hundreds in price.
When does bottled water genuinely matter?
There are real situations where bottled water is the right choice, and CDC and EPA say so explicitly — so "tap is fine" is not a universal prescription. The honest version is scenario-based: bottled earns its place when the tap supply is compromised or your household is unusually vulnerable.
During a boil-water advisory. A boil-water advisory means the water has, or could have, disease-causing germs including Cryptosporidium (CDC). The CDC advises using bottled water or boiled tap during the advisory period for drinking, food prep, and cooking, treating the two as equivalent safe options (CDC). One nuance: this applies to microbial (boil) advisories. For a chemical "do not drink" advisory, boiling doesn't help and bottled water is the required fallback.
After a disaster or main break. When water service is interrupted by a hurricane, flood, or water-main break, the CDC and EPA both recommend bottled, boiled, or treated water for drinking, cooking, prepared drinks, washing dishes, and brushing teeth until service is restored (CDC; EPA). This is the clearest case for keeping an emergency supply on hand.
When tap is known or suspected unsafe. The CDC advises bottled, boiled, or treated water if you know or suspect your water is unsafe — for example, an immunocompromised household member, or a private well that failed a test (CDC). If your CCR or an independent lab test flags a specific contaminant, a certified filter matched to that contaminant is usually the more durable fix than indefinite bottled water, but bottled bridges the gap.
In each of these cases, the deciding factor is the state of the tap supply, not a blanket belief that bottled is cleaner. When the tap is meeting EPA standards and your household has no special vulnerability, those conditions don't apply — and the cost and oversight comparisons above hold.
How do bottled and tap water compare side by side?
The table below puts the two side by side on the dimensions that determine which is "safer." On chemistry limits they're close by law; on testing frequency, transparency, cost, and disclosure, they diverge.
| Dimension | Tap (public water system) | Bottled water |
|---|---|---|
| Primary regulator | EPA, under the Safe Drinking Water Act | FDA, as packaged food under FD&C Act §410 |
| Mandatory annual public report | Yes — Consumer Confidence Report (40 CFR §141.151–155) | No CCR-equivalent |
| Mandatory violation notice | Yes — Public Notification Rule (40 CFR 141 Subpart Q) | No |
| Certified-lab testing required | Yes | No — bottlers may self-test |
| Coliform test frequency | 100+ per month (big-city, >100k people) | Once per week (21 CFR 129.80) |
| Lead limit | 15 ppb action level → 10 ppb under 2024 LCRI | 5 ppb (FDA) |
| Cost per gallon | ~$0.003 (EPA example; up to ~$0.011 some utilities) | ~$6–10+ single-serve (hundreds to ~1,000× tap) |
| Microplastics (particle count) | Baseline (treated tap) | ~3× tap by count; less plastic by mass |
| Typical source | Local surface/ground water, treated by utility | ~25–40% purified municipal tap; rest spring/well/other |
| Recall mechanism | EPA/state enforcement + mandatory public notice | Manufacturer-initiated, voluntary |
| US-national row | Regulated, publicly reported tap at ~$0.003/gal | 47.3 gal/person/yr (16.4B gal, $50.5B); ~25–40% repackaged tap |
Sources: EPA SDWA rules and CCR/Public Notification Rules (40 CFR Part 141); FDA bottled-water rules (21 CFR Parts 129 and 165); GAO-09-610 (2009); CDC (2024); NRDC (1999); Hart & Lenhart (2025) for microplastics; EPA WaterSense (2024) for tap cost; Beverage Marketing Corporation / IBWA (2024 data, 2025) for consumption. Cost and microplastics multiples are ranges with stated assumptions, not single figures. How this table was assembled: our data and methodology.
The "voluntary recall" row is worth a sentence on its own. The 2020 "Real Water" brand was linked to an acute non-viral hepatitis cluster with 21 probable cases across Nevada and California; the recall was manufacturer-initiated and voluntary, precisely because no mandatory public-notice system exists for bottled water (CDC MMWR, 2021). It's the regulation gap from earlier, made concrete.
Compare your tap to the bottle → Pull your utility's tested results and source, then decide with your own numbers — not a label.
Reading this from a different angle?
- Ready to pick a filter? Read our guide to NSF water-filter certifications — if your CCR flags a specific contaminant, matching a certified filter to it is the decision that pays off.
- On a tight budget? A $40 pitcher filter pays for itself in about six weeks versus a one-gallon-a-day bottled habit — see the full cost breakdown in how to improve your tap water's taste.
- Want the full regulatory map? Read who regulates your drinking water — the EPA, FDA, your state, your utility, and you, and exactly where each one's job starts and stops.
Methodology and disclosure
This guide draws on federal primary sources: EPA's Safe Drinking Water Act rules, the Consumer Confidence Report Rule (40 CFR §141.151–155), the Public Notification Rule (40 CFR 141 Subpart Q), the 2024 Lead and Copper Rule Improvements, and EPA WaterSense's water-cost example; the FDA's bottled-water rules (21 CFR Parts 129 and 165) and FD&C Act §410; GAO-09-610 on bottled-water oversight; and CDC drinking-water, emergency, and outbreak guidance, including the 2021 MMWR report on the "Real Water" outbreak. It also cites peer-reviewed microplastics research (Hart & Lenhart, 2025; Columbia/PNAS, 2024; Nihart et al., 2025), blind-taste-test studies (Debbeler et al., 2018; Journal of Sensory Studies, 2010), Beverage Marketing Corporation consumption data (2024 data, 2025), NAPCOR PET-recycling figures, Grand View Research market data, and the NRDC's 1999 bottled-water report (tagged advocacy, with its core regulatory facts conceded by the bottled-water industry). The Consumer Confidence Reports referenced are drawn from the data we aggregate across 18,774 US cities. TapWaterData sells no water and earns affiliate commission only on filters recommended in our Filter Buyer guides; this guide contains no affiliate links, but it links to those guides, which do. Our methodology — including how filters are scored (50% contaminant coverage + 30% Amazon rating + 20% affordability) — is published on our data page.