Yes — for almost everyone. An ion-exchange softener adds about 7.9 mg/L of sodium for every grain per gallon of hardness it removes, so in very hard water the finished glass lands near 159 mg/L. Two liters of that is 318 mg of sodium: roughly 14 percent of the 2,300 mg Daily Value, against an American food supply already delivering about 3,400 mg a day. The households that should look harder are the ones where somebody is on a medically restricted sodium intake — and for them the number is worth knowing rather than guessing.
Getting that number means answering a second question first: how much sodium was in the water before the softener? Every community water system in the United States is required by federal law to measure exactly that, and to mail the result to state and local public health officials within three months. It is not required to stay under any limit, because no limit exists — sodium has no Maximum Contaminant Level and does not appear on the secondary standards list either. And it is not required to tell you. Across the 10,570 systems that publish a figure in our dataset, the median is 13 mg/L and the range runs to 835 mg/L.
Quick facts
| Federal limit (MCL) | None. Sodium is not a regulated contaminant |
| Secondary standard | None. Sodium is absent from the 40 CFR 143.3 list |
| EPA taste recommendation | 30–60 mg/L, explicitly "not federally enforceable" |
| EPA guidance level | 20 mg/L — for people restricted to 500 mg sodium/day only |
| Monitoring | Required of every community system: yearly (surface water), at least every 3 years (groundwater) |
| Disclosure to customers | Not required |
| US systems publishing a figure | 10,570 of 19,605 (53.9%) |
| Median / 95th percentile / highest | 13 / 150 / 835 mg/L |
| Systems above EPA's 20 mg/L guidance level | 4,124, serving 75.5 million people |
| Typical softener contribution | ~7.9 mg/L per grain per gallon of hardness removed |
Sources: 40 CFR 141.41, 141.153, 143.3; EPA 822-R-03-006 (2003); TapWaterData analysis of 19,605 US community water systems, August 2026.
How much sodium is in tap water?
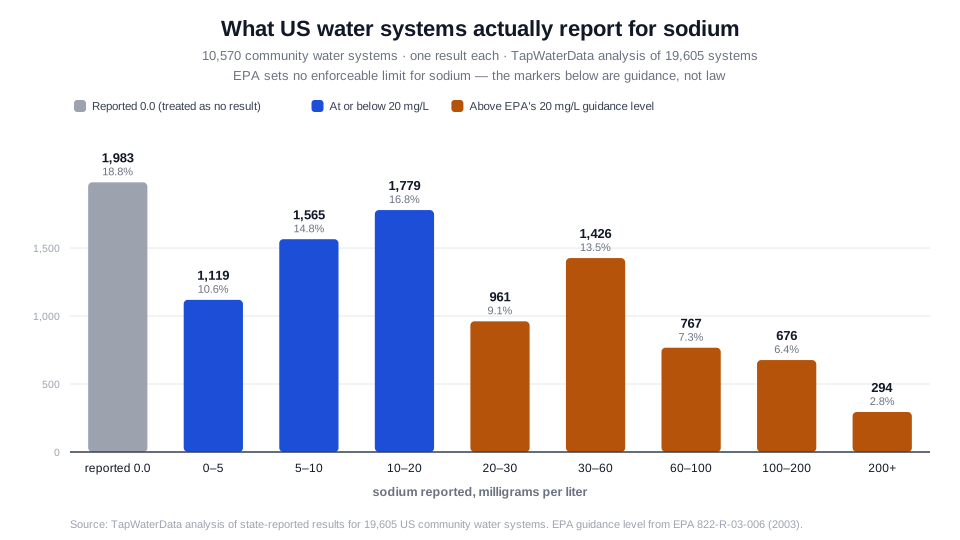
Most US tap water is low in sodium, and a meaningful minority is not. Grouping the 10,570 reporting systems by concentration: 6,446 (61.0%) report 20 mg/L or less, 4,124 (39.0%) report more than 20 mg/L, and 294 report more than 200 mg/L. The systems above 20 mg/L serve about 75.5 million people (TapWaterData, 2026).
One column deserves its own explanation. 1,983 systems (18.8%) report a flat 0.0. Sodium is never truly absent from water — EPA's own national survey found detectable sodium in "almost 100%" of the systems it tested (EPA, 2003) — so a reported zero here is far more likely to mean no result on file than none present. We show it separately rather than folding it into the low end, because doing otherwise would quietly flatter the numbers. Counting only systems that report an actual concentration, the median rises from 13 to 18.9 mg/L, and the share above 20 mg/L rises from 39.0% to 48.0%.
We checked this distribution against an independent benchmark before publishing it. EPA's National Inorganic and Radionuclide Survey sampled 989 groundwater community water systems chosen to be statistically representative of national occurrence, and found a median of 16.4 mg/L, with 37% above 30 mg/L and 13% above 120 mg/L (EPA, 2003). Our groundwater systems give a median of 13.8 mg/L counting the zeros and 20.8 mg/L excluding them, with 31.8% and 39.4% above 30 mg/L respectively. On both of those measures EPA's national survey falls between our two treatments of those ambiguous zeros — which is the outcome you would want, and the reason we are willing to put the distribution in front of you.
One measure does not match, and it is worth saying so. At the extreme end, NIRS found 13% of groundwater systems above 120 mg/L against our 8.2% to 10.2%, and its 99th percentile was 517 mg/L against our 284 to 300. Our upper tail is lighter than EPA's. NIRS was a purpose-built survey that went and sampled 989 systems; ours is what states forward from routine compliance monitoring, and the very small systems that carry the most extreme sodium are exactly the ones whose results are least likely to make that trip. Read the high end of this distribution as a floor.
Why isn't sodium on my water quality report?
This is the part that surprises people, and it is a quirk of how two separate rules interact.
40 CFR 141.41 is titled Special monitoring for sodium. It requires suppliers for community water systems to "collect and analyze one sample per plant" at the entry point to the distribution system — annually for surface water sources and at least every three years for groundwater. It then requires that "the supplier of water shall notify appropriate local and State public health officials of the sodium levels by written notice by direct mail within three months."
Note who gets the letter. Public health officials do. You are not mentioned.
Meanwhile the Consumer Confidence Report — the annual report your utility does send you — is governed by 40 CFR 141.153. Its mandatory table covers contaminants "subject to a MCL, action level, maximum residual disinfectant level, or treatment technique," and unregulated contaminants "for which monitoring is required by § 141.40." That section number is the whole story: §141.40 is the Unregulated Contaminant Monitoring Rule, a rotating five-year program. Sodium is monitored under §141.41, a different section, so it falls outside the required table. The rule adds that "any additional monitoring results which a community water system chooses to include in its report must be displayed separately."
The rule does go one step further, and the wording is worth reading closely. Where a system's own monitoring turns up something above "a proposed MCL or health advisory level," EPA "strongly encourages systems to report any results which may indicate a health concern." Encourages. Not requires. Sodium has a health advisory level; it does not have a rule compelling anyone to tell you when your water is above it.
The practical consequence is the 53.9% figure above. Roughly half of US community water systems publish a sodium number somewhere a member of the public can find it. The other half measured it, mailed it to a health department, and stopped. If your report has no sodium line, that is not necessarily a gap in your utility's diligence — it is the rule working as written.
Where does the sodium in tap water come from?
Four sources, and they are not equally obvious.
Geology. Sodium is the sixth most abundant element on Earth and its salts dissolve readily, so groundwater passing through sodium-bearing minerals picks it up. This is why groundwater systems generally run higher than surface water systems — in our data, a median of 13.8 mg/L against 11.2, with 41.0% of groundwater systems above 20 mg/L against 33.6% of surface systems.
Seawater and road salt. Coastal aquifers take on sodium through saltwater intrusion, and de-icing salt washes off roads into both surface and groundwater supplies. Both are gradual and both are hard to reverse once established.
The treatment plant itself. This one is genuinely under-known. Sodium hydroxide, sodium carbonate and sodium bicarbonate are standard chemicals for adjusting pH and controlling corrosion — including the corrosion control that keeps lead out of drinking water. EPA's advisory states these "can contribute from 27 to 57 mg/L sodium to water at their approved maximum use levels" (EPA, 2003, citing NSF 1997). At the top of that range, the plant can add more sodium than the source water contained.
Your own water softener. EPA's advisory puts this bluntly: "Domestic water softeners can increase sodium levels to more than 300 mg/L in drinking water" (EPA, 2003, citing NAS 1977). For most households with hard water, this is the largest of the four by a wide margin — which is the next section.
How much sodium does a water softener add?
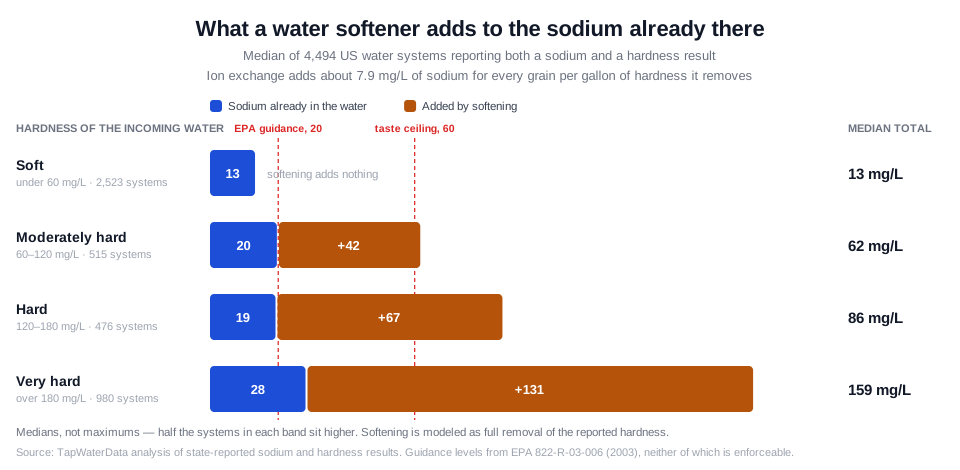
An ion-exchange softener does not remove hardness so much as trade it. Calcium and magnesium come off the resin, sodium goes on. The exchange is stoichiometric, so the sodium added is set by the hardness removed, and the arithmetic is short: 1 grain per gallon is 17.1 mg/L as calcium carbonate, which has an equivalent weight of 50, so 1 gpg is 0.342 milliequivalents per liter — and 0.342 meq/L of sodium, at an equivalent weight of 23, is 7.87 mg/L.
Published figures cluster tightly around that. The Water Quality Association's "30 mg of sodium per gallon per grain" works out to 7.93 mg/L. Virginia Cooperative Extension states "about 1 mg/L of sodium added for every 2.1 mg/L of hardness removed," which is 8.14 (Benham et al., 2024). Trade literature often rounds to 7.5. We use 7.9 mg/L per grain per gallon, and 7.5–8.1 is the honest band.
Applying it to the 4,494 systems where our dataset holds both a sodium and a hardness result, the median household goes from 18.6 mg/L to 68.5 mg/L after full softening. Broken out by how hard the incoming water is:
| Incoming hardness | Systems | Sodium in the supply | Softener adds | Median total |
|---|---|---|---|---|
| Soft (under 60 mg/L) | 2,523 | 13 mg/L | nothing | 13 mg/L |
| Moderately hard (60–120) | 515 | 20 mg/L | +42 | 62 mg/L |
| Hard (120–180) | 476 | 19 mg/L | +67 | 86 mg/L |
| Very hard (over 180) | 980 | 28 mg/L | +131 | 159 mg/L |
These are medians, so half the systems in each band sit higher, and the model assumes the softener removes all the hardness reported. Two things stand out. In very hard water the softener contributes about 82 percent of the sodium in the finished glass. And a household in that band lands near 159 mg/L — roughly eight times EPA's 20 mg/L guidance level and comfortably past the 30–60 mg/L range EPA recommends on taste grounds. Neither is a violation of anything. There is nothing to violate.
For scale from a different direction: if tap water were sold in a bottle, FDA's labeling rules would let it claim "sodium free" only below 13.9 mg/L, since the reference serving for water is 360 mL and the claim requires under 5 mg per serving (21 CFR 101.12, 101.61). 48.1 percent of the systems that publish a number could not make that claim. Bottled water gets a label. Your tap does not.
Does the sodium in your tap water actually matter?
For most people, no, and the clearest statement of that comes from the agency itself: "Drinking water does not play a significant role in sodium exposure for most individuals" (EPA, 2003).
The arithmetic backs it up. Americans eat about 3,400 mg of sodium a day, against a Dietary Guidelines limit of less than 2,300 mg (FDA). Two liters of water gives you:
| Water at | Sodium per day (2 L) | Share of the 2,300 mg Daily Value |
|---|---|---|
| 13 mg/L (US median) | 26 mg | 1.1% |
| 20 mg/L (EPA guidance level) | 40 mg | 1.7% |
| 60 mg/L (top of the taste range) | 120 mg | 5.2% |
| 159 mg/L (softened very hard water) | 318 mg | 13.8% |
| 835 mg/L (highest we found) | 1,670 mg | 72.6% |
Against a food supply delivering 3,400 mg, the first three rows are rounding error. That is the right frame for the overwhelming majority of readers, and any page that tells you otherwise is selling something.
Two qualifications, and they are real.
The first is that EPA's 20 mg/L figure is not a general safety threshold and should not be read as one. EPA is explicit: it "was developed for those individuals restricted to a total sodium intake of 500 mg/day and should not be extrapolated to the entire population." A 500 mg/day diet is a strict clinical restriction, not general healthy-eating advice. When you see a claim that tens of millions of Americans drink water "over EPA's sodium limit," that is two errors in one sentence — there is no limit, and the number being cited was built for a small clinical group.
The second is that for people in that group, or on any medically supervised sodium restriction, the proportions change completely. Two liters of softened very hard water is 318 mg — 13.8% of the 2,300 mg Daily Value, but 64% of a 500 mg/day restriction. A number that is rounding error on an ordinary diet is most of the budget on a restricted one, and it arrives invisibly through the kitchen tap. EPA's own advice is that people "under treatment for sodium-sensitive hypertension should consult with their health care provider regarding sodium levels in their drinking water supply." That is a conversation with a doctor who has your numbers, and it needs your water's number as an input — which brings us back to the fact that half of US utilities never publish one.
Is softened water safe to drink?
For almost everyone, yes — and the reasons are worth separating, because "safe" is doing two different jobs in that sentence.
On sodium, the table above is the answer: even the very-hard-water case lands at 13.8% of the Daily Value. Softened water is not a meaningful sodium source for a person without a sodium restriction. For a person with one it can be a meaningful fraction of a small budget, and the fix is a plumbing detail rather than a lifestyle change.
On the minerals it removes, hard water does supply some calcium and magnesium, and softening trades them away. That is a real change, but a small one against food, and it is the subject of our hard water vs soft water comparison rather than this page.
The honest exceptions, in order of how often they actually apply:
- Anyone on a medically restricted sodium intake. EPA's own advice is that people "under treatment for sodium-sensitive hypertension should consult with their health care provider regarding sodium levels in their drinking water supply." Bring the number, not a guess.
- Infant formula preparation, where a doctor or pediatrician has raised sodium specifically. The general advice on formula water is a separate question from softening.
- Houseplants and aquariums, which is not a human-safety issue at all but is the most common real-world complaint about softened water. Use an outside spigot or an unsoftened line.
What is not on that list: a healthy adult drinking ordinary softened water.
How do I find the sodium level in my water?
Start with your Consumer Confidence Report and search it for "sodium." If it is there, you are done — note the date alongside the number, because these results are often several years old. In our own dataset, 62 percent of sodium results date from 2022.
If it is not there, ask your utility directly. They have the number; §141.41 required them to collect it. Ask for the most recent sodium result at the entry point to the distribution system, the sample date, and which treatment plant serves your address. That last question matters more than it sounds: El Paso Water's published chemical analysis reports seven separate sources ranging from 105 to 217 mg/L, several of them seasonal — a single "citywide" figure would misrepresent most addresses. The same document, incidentally, lists the standard for sodium as "Not established," which is a utility's own way of saying what this article has been saying throughout.
You can also check what our own dataset holds for your system on your city page, with one caveat we would rather state than bury: our aggregate distribution is validated against EPA's national survey and against utilities' own reports, but individual rows are not each independently verified. Where we spot-checked, San Diego's 2024 report gives treatment-plant averages of 78 to 109 mg/L against the 76.6 in our data, and El Paso's own analysis brackets the 134 we hold. One did not reconcile — our figure for Las Vegas Valley Water District is far below what a Colorado River source would suggest, and we have not been able to verify it against a published district figure, so we are not repeating it. Treat any single number here as a starting point for the question you put to your utility, not the end of it.
If you have a softener, do the last step yourself: take your hardness in grains per gallon, multiply by 7.9, and add it. Our water hardness pages will give you the hardness figure if you do not have one.
How do I reduce the sodium in my tap water?
Match the fix to the source, because most of the obvious moves do nothing.
If a softener is the source — bypass the kitchen. Virginia Cooperative Extension puts the standard advice plainly: "you can avoid adding sodium to drinking water by softening only the hot water (used for laundry, bathing, and cleaning) and leaving the cold water lines untreated for drinking and food preparation" (Benham et al., 2024). You keep the softener doing the job you bought it for — scale, soap, appliances — and drinking and cooking water never touches the resin. On a new install this is a plumbing decision that costs almost nothing; on an existing one it is a fitting and an hour.
Potassium chloride instead of sodium chloride is the other softener answer, and it works identically, exchanging hardness for potassium. It costs meaningfully more per bag. It is also not a free upgrade: the same Extension publication warns that "excess potassium in drinking water can also present health risks to certain segments of the population, including individuals with kidney disease (most at risk)." If the reason you are reading this is a kidney condition, potassium chloride may be the wrong direction, and that is a question for your doctor rather than a softener salesperson.
A salt-free conditioner sidesteps the problem entirely, because it does not exchange anything — it conditions the hardness rather than removing it. Your hardness number does not change, so it is not a substitute if what you need is genuinely soft water.
Reverse osmosis and distillation both remove sodium, and Virginia Cooperative Extension names those two as the point-of-use options for sodium and chloride (Benham et al., 2024). With reverse osmosis the evidence is unusually direct: the required performance test for an NSF/ANSI 58 certification is a total-dissolved-solids reduction of at least 75% against a 750 mg/L sodium chloride challenge. Removing sodium is not an optional extra claim on an RO system — it is the baseline the standard is built on. If the sodium is in the supply rather than added by a softener, an under-sink RO unit at the kitchen tap is the direct answer, and our sodium contaminant page lists certified systems.
What does not work: activated carbon in any form. Pitchers, faucet-mounts, most under-sink cartridges and refrigerator filters are built for chlorine, taste, odor and organic chemicals. Dissolved inorganic ions pass through carbon media, which is why NSF/ANSI 42 (aesthetic effects) and NSF/ANSI 53 (health effects) carry no sodium-reduction claim at all. Boiling is worse than useless — it drives off water and leaves the sodium behind, concentrating it.
Methodology and disclosure
The occurrence figures come from TapWaterData's analysis of state-reported results for 19,605 distinct public water systems serving 279.3 million people, deduplicated by PWSID from 18,737 city files. Sodium is reported once per system, always in mg/L. Systems reporting a flat 0.0 are treated as ambiguous throughout and every share is given on both bases. The softening model assumes complete removal of the reported hardness at 7.9 mg/L of sodium per grain per gallon. Sample dates skew to 2022; 1,299 results are from 2025 and 27 predate 2020. The full numbers ledger, the verification log, and the script that reproduces every figure are published with our research.
Regulatory text is quoted from 40 CFR 141.41, 141.153 and 143.3, and from EPA 822-R-03-006, Drinking Water Advisory: Consumer Acceptability Advice and Health Effects Analysis on Sodium (February 2003). Dietary figures are from FDA. Softening chemistry and household guidance are from Virginia Cooperative Extension publication 442-661 (Benham, Ling and Haering, December 2024). Full methodology: our data page.
Disclosure. TapWaterData earns affiliate commission on some filter and softener links elsewhere on this site. This guide's central recommendation — bypass the cold kitchen line, a plumbing fitting that costs a fraction of any treatment system — earns us nothing, and it points away from the reverse-osmosis and softener products we do earn on. No manufacturer reviewed or funded this article.