Tucson Water
Tucson, Arizona · 2024 data
Tucson pairs the most rigorous monitoring story in the cohort with unusual candor — it volunteers far more testing than required and openly documents a violation most utilities would bury. The only thing holding it back is format: all of that lives in a polished PDF with no responsive online version.
What their report looks like
How it scored, pillar by pillar
Weighted across five pillars for a 83/100 overall. Each note explains why this report earned that score.
Plain-language clarity25% of score
Plain-language framing throughout; even the monitoring violation is explained in terms a resident can follow rather than regulatory shorthand.
A 5/5 looks like: Every term is translated, units are made tangible (e.g. an Olympic-pool analogy), and each section opens with what it means for you.
Contaminant transparency25% of score
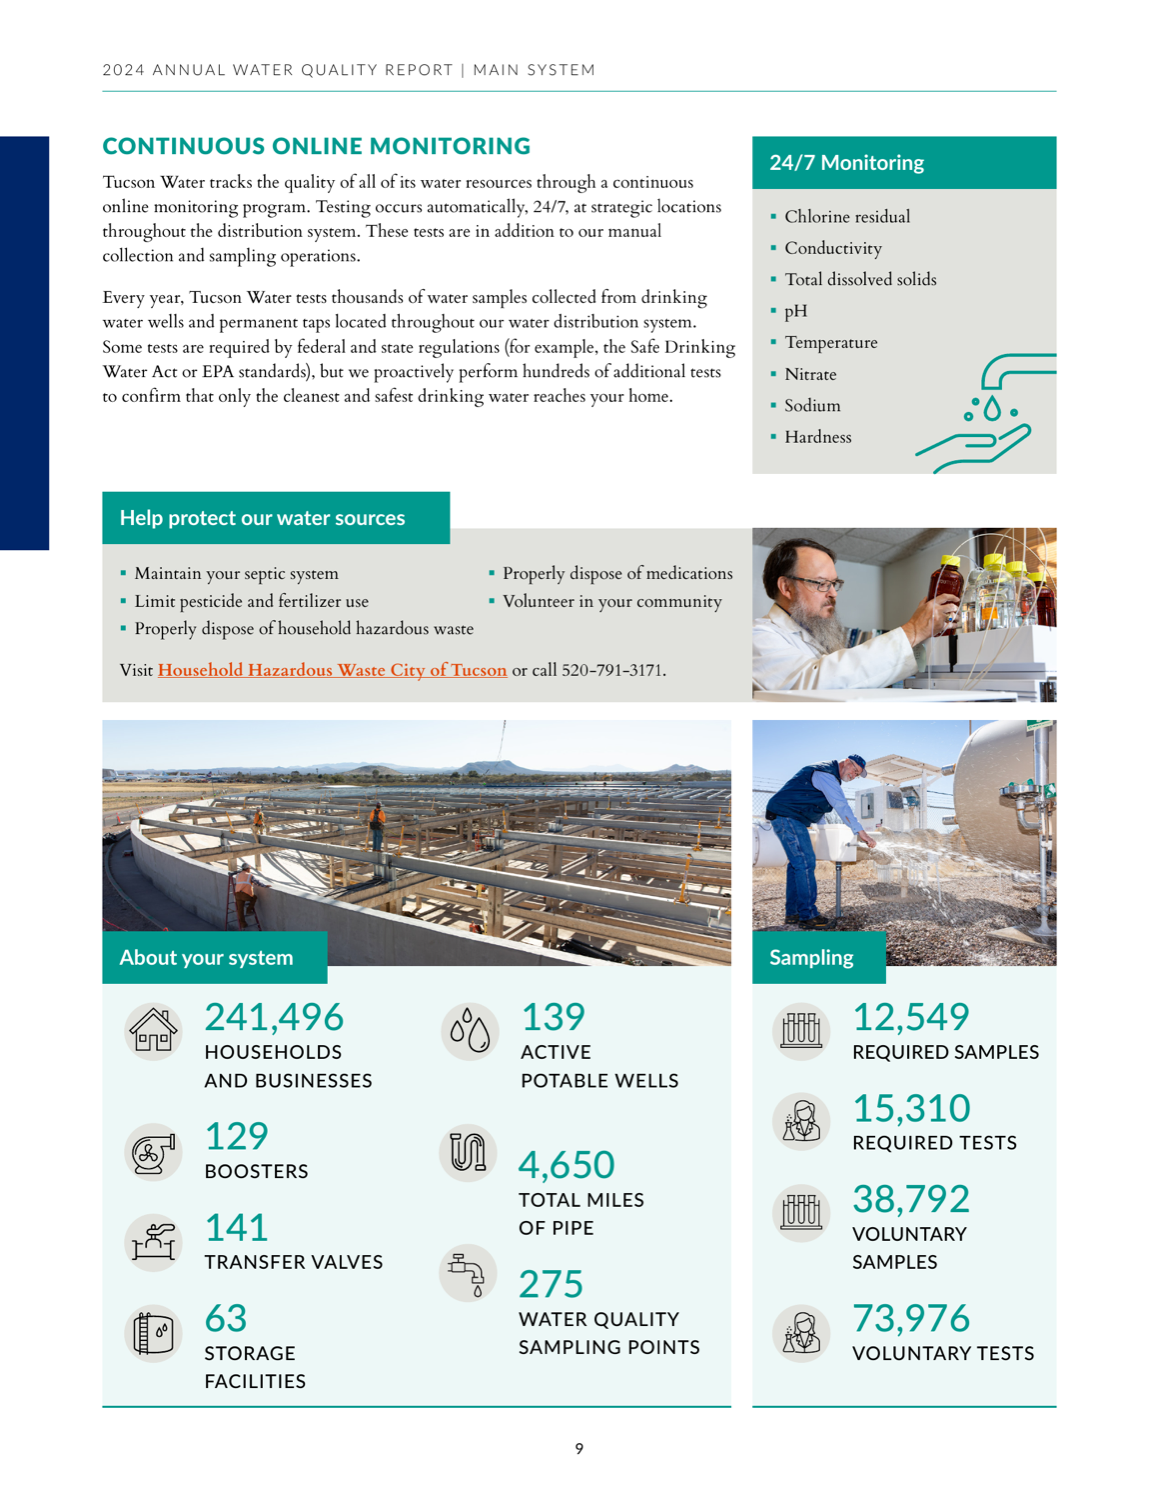
Exceptional — 38,792 voluntary samples against 12,549 required, a plainly disclosed missed-monitoring violation naming all six parameters and how it was closed, and a stated policy of pulling any well with detectable PFOA or PFOS.
A 5/5 looks like: PFAS, lead and any exceedances are shown with real values against the limits, and problems are disclosed plainly rather than buried.
Information design20% of score
Clean, well-organized data presentation, though it stops short of the chart-against-the-limit visual encoding the very top reports use.
A 5/5 looks like: Contaminant data is visually encoded — charts against limits, multi-year trends, comparisons a layperson reads at a glance.
Digital accessibility & delivery20% of score
A polished but downloadable PDF — there is no responsive web-native report and no address lookup, which caps how usable it is on a phone.
A 5/5 looks like: A responsive web-native report with navigation, charts, and an address lookup — not just a PDF.
Timeliness & completeness10% of score
Recent (2024) data with a thorough panel; the voluntary-monitoring program makes it one of the most complete in the cohort.
A 5/5 looks like: The most recent data year, with a complete contaminant panel including unregulated/emerging compounds.
marks the cohort average across all 25 reviewed reports.
What it does best
- The most rigorous voluntary-monitoring story in the cohort: 38,792 voluntary samples against 12,549 required.
- Discloses a missed-monitoring violation in plain language, naming the six parameters and how it was closed.
- A standing policy of removing any well with detectable PFOA or PFOS — and it says so.
Where it falls short
It is a polished PDF, not a web-native report — there is no responsive online version or address lookup.
How it compares
Tucson Water's report ranks #3 of 25 reviewed utilities, with a report-clarity score of 83/100 against a cohort median of 69. That places it in the top 12%.
See the full leaderboardWhat even this report can't tell you
A report describes the water leaving the plant, not what reaches your tap — your building's plumbing is where lead usually enters.
See Tucson's water data
Tucson Water, display your badge
Free to use. It links back to this page so residents can see how the report was scored. Paste this where you list your recognitions.
Independent and free. Displaying the badge does not affect rank. If any detail of your score is off, email us and we will correct it.
Stay Informed About Your Water Quality
Get EPA reports, filter recommendations, and safety alerts for your area.
Join 10,000+ people protecting their families. Unsubscribe anytime.