DC Water
Washington, District of Columbia
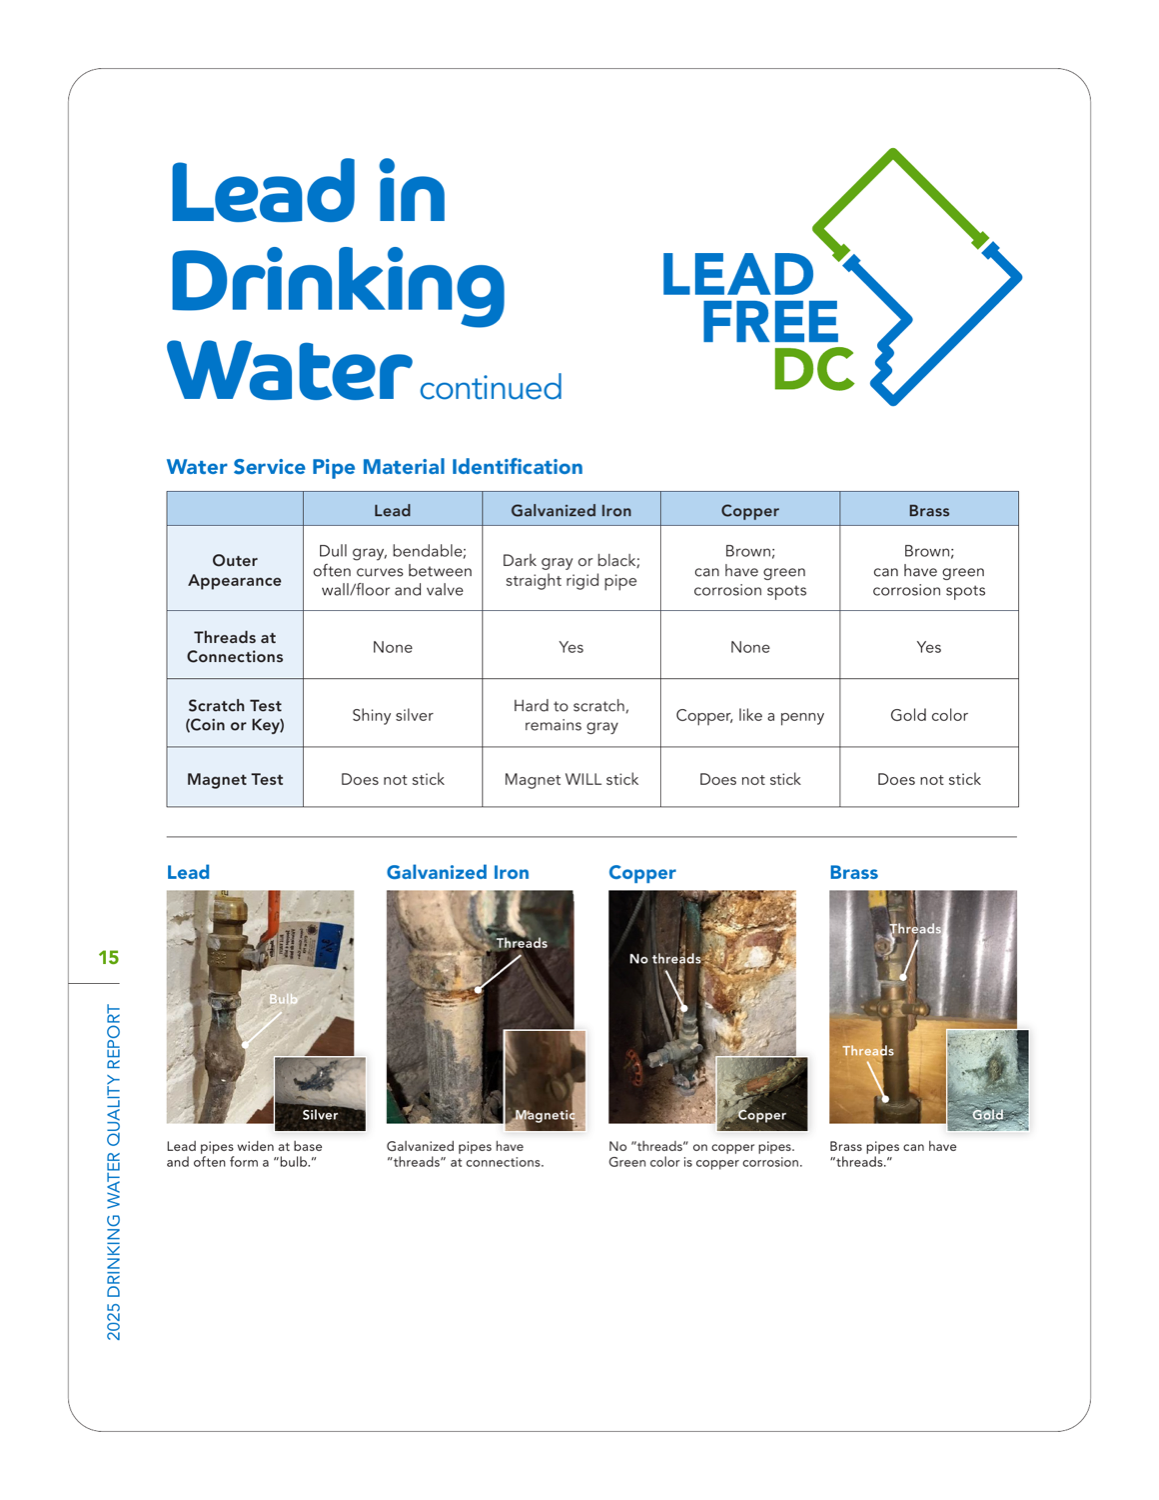
DC Water turns the most anxiety-inducing question — “do I have a lead pipe?” — into something a resident can actually answer, with a scratch-and-magnet test matrix and annotated photos of lead, galvanized iron, copper and brass pipes that no other report attempts. It backs that with voluntary PFAS testing against the new federal limits. It remains a PDF, which is the main ceiling on it.
Scored edition: 2025 Drinking Water Quality Report (2024 data). DC Water has also published its 2026 Drinking Water Quality Report (2025 data), which was not scored.
- Corrected September 13, 2026: Each scorecard now names and links the exact report edition we scored, and notes any newer edition the utility has published. Some report links had pointed to pages that have since moved on to a newer edition.
- Corrected September 13, 2026: The scorecard described annotated basement photos. The report's pipe-identification photos are annotated pictures of lead, galvanized iron, copper and brass pipes, and the report does not present them as basement photos. Its timeliness note claimed a complete regulated panel; the report's tables list the contaminants that were detected.
- Corrected September 13, 2026: Verdicts that named one factor as the only thing holding a report back now name it as the main one, matching sub-scores in which more than one pillar is below 5.
- Corrected September 13, 2026: Mount Pleasant Waterworks' transparency score changed from 5 to 4, moving it from #2 to #5 (still Gold, now 80/100); Tucson Water, DC Water and Denver Water each move up one place. Its report prints its PFAS results, including PFOS at 6.6 ppt, in a table that gives no limits and says such compounds may not have health-based standards, without mentioning the EPA's 4 ppt limit that result is above. The top transparency score calls for results shown against the limits and problems disclosed plainly.
What their report looks like
How it scored, pillar by pillar
Weighted across five pillars for a 82/100 overall. Each note explains why this report earned that score.
Plain-language clarity25% of score
Plain-language framing throughout, down to putting the cost of bottled water in perspective; the lead self-identification walkthrough is written for a homeowner, not an engineer.
A 5/5 looks like: Every term is translated, units are made tangible (e.g. an Olympic-pool analogy), and each section opens with what it means for you.
Contaminant transparency25% of score
Voluntary PFAS results shown against the new EPA limits with per-site UCMR5 data, and a forthright treatment of lead risk rather than a bare compliance line.
A 5/5 looks like: PFAS, lead and any exceedances are shown with real values against the limits, and problems are disclosed plainly rather than buried.
Information design20% of score
Strong use of annotated photos and a test matrix to encode the lead-check process visually; conventional tables elsewhere keep it just short of the top.
A 5/5 looks like: Contaminant data is visually encoded — charts against limits, multi-year trends, comparisons a layperson reads at a glance.
Digital accessibility & delivery20% of score
Delivered as a downloadable PDF rather than a web-native experience, which limits how accessible it is on a phone.
A 5/5 looks like: A responsive web-native report with navigation, charts, and an address lookup — not just a PDF.
Timeliness & completeness10% of score
Tables of the regulated and unregulated contaminants detected, plus a summary of voluntary PFAS monitoring.
A 5/5 looks like: The most recent data year, with a complete contaminant panel including unregulated/emerging compounds.
marks the cohort average across all 25 reviewed reports.
What it does best
- The best lead-pipe self-identification content anywhere: a scratch-and-magnet test matrix with annotated photos of lead, galvanized iron, copper and brass pipes.
- Voluntary PFAS results shown against the new EPA limits, plus per-site UCMR5 data.
- Plain-language framing throughout (it even puts the cost of bottled water in perspective).
Where it falls short
It lives as a downloadable PDF rather than a web-native experience, which caps how accessible it is on a phone.
How it compares
DC Water's report ranks #3 of 25 reviewed utilities, with a report-clarity score of 82/100 against a cohort median of 69. That places it in the top 12%.
See the full leaderboardWhat even this report can't tell you
A report describes the water leaving the plant, not what reaches your tap — your building's plumbing is where lead usually enters.
See Washington's water data
DC Water, display your badge
Free to use. Both versions link back to this page so residents can see how the report was scored. Paste either one where you list your recognitions; use the text link if your site strips images.
Independent and free. Displaying the badge does not affect rank. If any detail of your score is off, email hello@tapwaterdata.com and we will review the source and correct it.
Get the Weekly Water Brief
One email a week on water testing, treatment, and what water-quality data means for your home.
One email a week. Unsubscribe anytime.