About 90% of Americans get their tap water from one of roughly 50,000 community water systems — 61% from surface water, 39% from groundwater. Another 40 million Americans drink from private wells with no federal regulation.
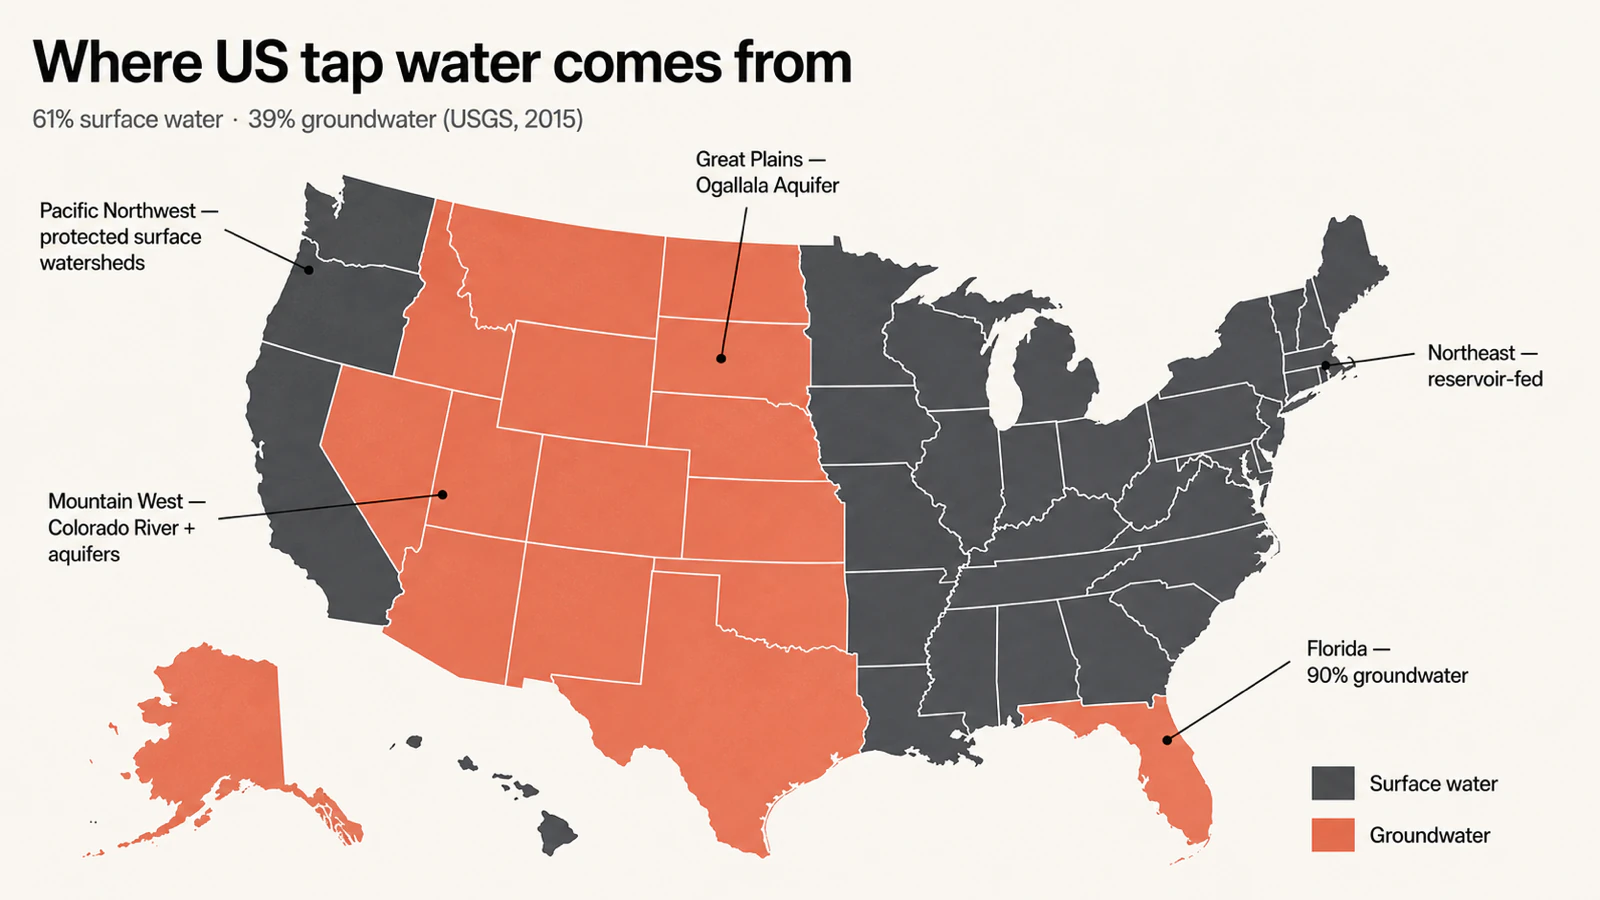
About 270 million Americans (roughly 90% of the country) drink tap water from one of approximately 50,000 community water systems regulated under the EPA's Safe Drinking Water Act (EPA SDWIS, 2024). Another ~40 million rely on private wells with no federal oversight (USGS Johnson et al., 2019). Of the public-supply water withdrawn each day, 61% comes from surface sources — rivers, lakes, reservoirs — and 39% from groundwater aquifers (USGS Circular 1441, 2015).
Source matters because it predicts what's in your tap. Surface-water systems tend toward disinfection byproducts, pathogens, and agricultural runoff. Groundwater systems lean toward naturally occurring arsenic, radium, and — increasingly — PFAS plumes from industrial and military sites. The contaminant profile that matters in Miami isn't the one that matters in Chicago, which isn't the one that matters in San Antonio.
This guide walks through where US tap water actually comes from at a national scale, which big cities and aquifers serve the most people, how PFAS is reshaping the map, and what your source tells you about the next decision (testing, filter type, what to watch on your CCR). The fastest way to translate the national picture to your tap is to look up your city on TapWaterData — every community system in the US is in the database.
Key Takeaways
- About 270 million Americans drink public-system water. Roughly 50,000 community water systems serve them; another ~40 million rely on private wells with no federal regulation (EPA SDWIS, 2024; USGS, 2019).
- Surface water serves more people, but more systems use groundwater. 61% of public-supply volume comes from rivers, lakes, and reservoirs; 39% comes from aquifers (USGS Circular 1441, 2015).
- A handful of cities import water hundreds of miles. Los Angeles, Las Vegas, Phoenix, and New York City pull from sources 125–444 miles away; most Americans drink water sourced within ~100 miles of home.
- Source type predicts your contaminants. Surface water leans toward disinfection byproducts and pathogens; groundwater leans toward arsenic, radium, and PFAS.
- 45% of US tap-water samples contain detectable PFAS (USGS, 2023). Groundwater is not automatically cleaner — 60% of public-supply wells sampled across the eastern US contained PFAS (USGS McMahon et al., 2022).
How many Americans drink from a public water system?
Roughly 270 million Americans — about 90% of the country — receive tap water from a public water system regulated under the EPA's Safe Drinking Water Act (EPA, 2024). The EPA's SDWIS database tracks between 148,000 and 156,000 public water systems nationwide depending on the quarter; of these, about 50,000 are Community Water Systems (CWS) — the systems that deliver drinking water to people in their homes year-round. The remaining ~100,000 are non-community systems serving schools, factories, campgrounds, and gas stations (EPA SDWIS, 2024).
System size is highly skewed. About 8% of community water systems — roughly 4,200 large utilities — serve more than 80% of the population (over 246 million people), per EPA's 2024 service-area data release. The other ~46,000 systems are small. About half of all CWSs serve fewer than 500 people, and these small systems account for a disproportionate share — roughly 80% — of Safe Drinking Water Act violations (EPA, 2024). They are also more likely to serve low-income and disadvantaged communities.
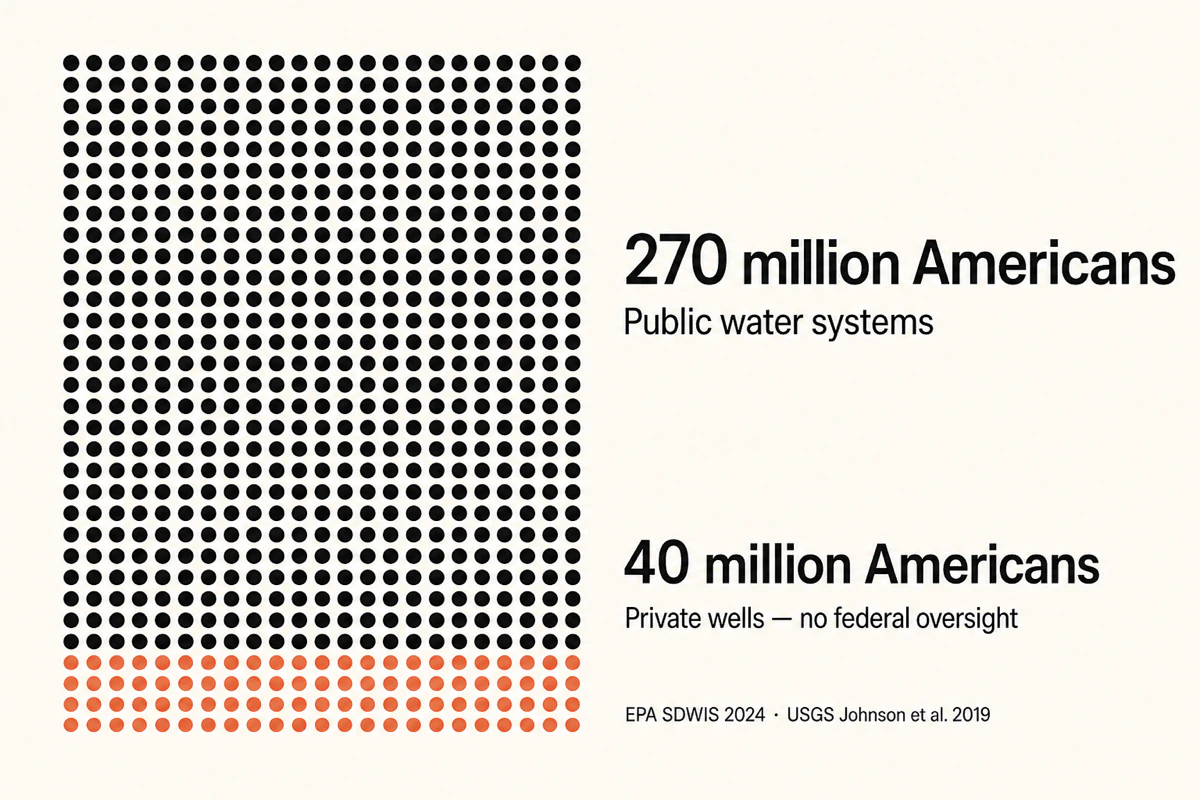
The remaining ~40 million Americans rely on private domestic wells, which the federal Safe Drinking Water Act does not cover (USGS Johnson et al., 2019). Homeowners are responsible for their own testing and treatment. USGS national sampling of private wells found that about 1 in 5 (22%) contained at least one contaminant above a human-health benchmark — naturally occurring arsenic, manganese, and radon accounting for ~80% of exceedances, and nitrate the leading manmade contaminant (USGS, 2019).
Surface water vs. groundwater: where does most US tap water come from?
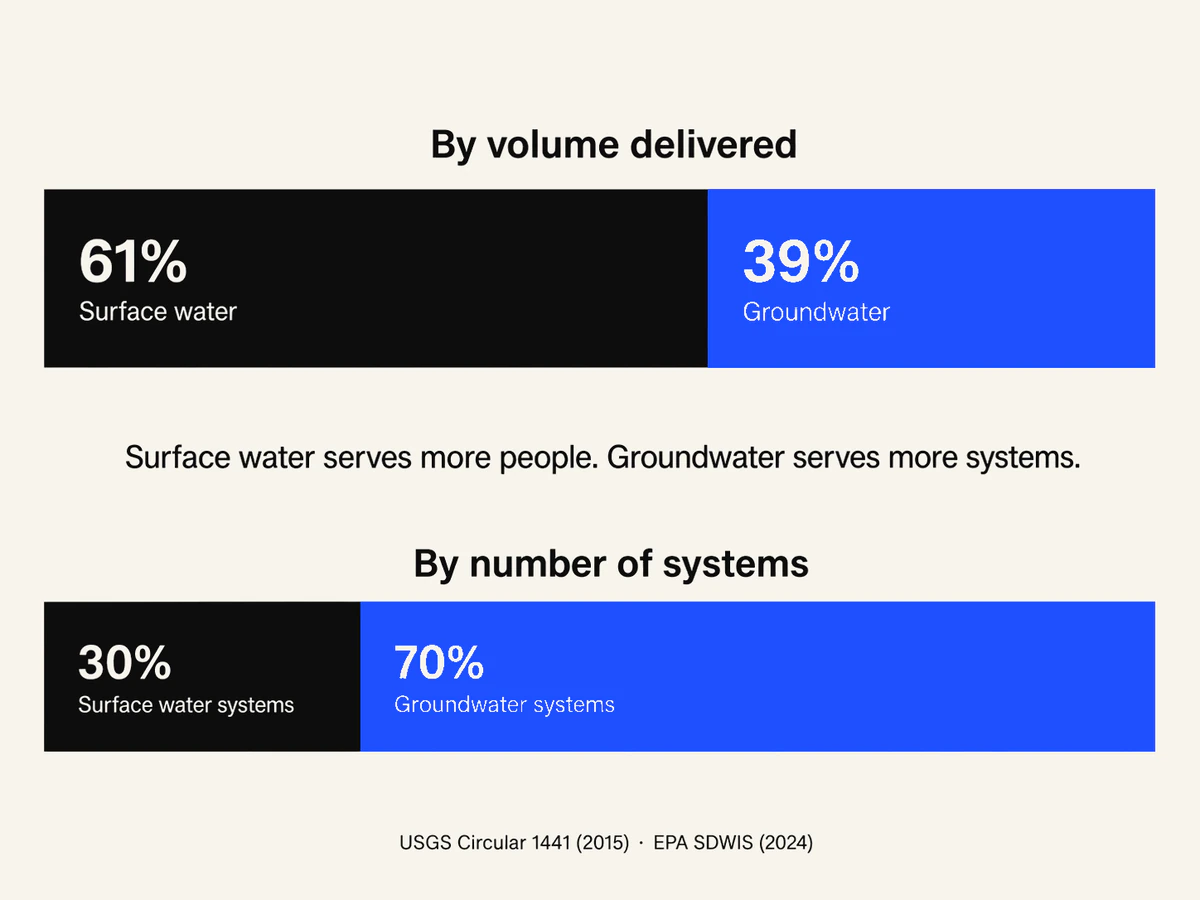
The split between surface and groundwater is counterintuitive. Surface water supplies most of the volume of US drinking water; groundwater serves most of the systems.
Of the ~39 billion gallons per day withdrawn for public supply in 2015, about 61% came from surface water and 39% from groundwater (USGS Circular 1441, 2015). But because large cities tend to draw from surface water and small towns from groundwater wells, more individual community water systems use groundwater (well-supplied) than surface water — even though more people drink surface water overall. About 100 million Americans get their drinking water from public-supply wells, and another 40–43 million from private wells, per USGS estimates.
Regional patterns are pronounced. The Northeast and Pacific Northwest depend on protected surface watersheds with snowmelt-fed reservoirs (NYC's Catskill/Delaware, Boston's Quabbin, Seattle's Cedar River, Portland's Bull Run). Florida is 90% groundwater-supplied, drawing from the Floridan and Biscayne aquifers. The Mountain West runs on Colorado River snowmelt, and the Southwest has the highest aquifer dependence in the country (Phoenix, Tucson, El Paso). Texas is a hybrid — Houston and Dallas pull primarily from surface water; San Antonio is wholly dependent on the Edwards Aquifer.
If you don't know which source your utility uses, your annual Consumer Confidence Report (CCR) names it explicitly — every community water system is required to publish one by July 1 each year. (For a step-by-step walk-through, read How to Read Your Consumer Confidence Report.)
What about the 40 million Americans on private wells?
USGS estimates ~40 million Americans rely on private domestic wells, with EPA placing the upper bound at "more than 43 million" (USGS Johnson et al., 2019; EPA, 2024). These wells are not regulated by the federal Safe Drinking Water Act — there is no annual CCR, no required testing, no enforcement mechanism. The homeowner is responsible.
The geographic concentration is sharp. Michigan has the largest private-well population at roughly 1.1 million wells (USGS), followed by Pennsylvania, New York, North Carolina, and Ohio. Iowa, Minnesota, and Wisconsin have among the highest per-capita reliance — USGS reports 74% of Minnesotans rely on groundwater for drinking water.
USGS national sampling found about 22% of private wells contained at least one contaminant above a human-health benchmark, with naturally occurring arsenic, manganese, and radon driving ~80% of exceedances and nitrate the leading manmade contaminant (USGS, 2019). If you're on a private well, an annual test for total coliform and nitrate is the minimum; a one-time baseline panel for arsenic, lead, manganese, radon, uranium, and fluoride (plus pesticides or PFAS if there's local industry / agriculture) is the appropriate first move within your first year of ownership.
Which big cities import water from far away?
A handful of major US cities import their water hundreds of miles, often by gravity through engineered aqueducts.
New York City draws ~1.1 billion gallons/day from 19 reservoirs and 3 controlled lakes across the Catskill, Delaware, and Croton watersheds — covering ~2,000 square miles up to 125 miles north of the city (NYC DEP, 2024). The Catskill/Delaware system supplies about 90% of NYC's water and is one of the largest unfiltered surface water supplies in the world, operating under an EPA Filtration Avoidance Determination because the watershed is so well-protected.
Los Angeles and Southern California are the textbook case of imported water. The Metropolitan Water District of Southern California (MWD) supplies water to ~19 million people in six counties. Roughly 20% comes from the Colorado River via the 242-mile Colorado River Aqueduct (which lifts water ~1,600 feet over mountains), 30% from Northern California via the 444-mile California Aqueduct, and ~50% from local sources including LA's 233-mile Owens Valley Aqueduct, groundwater, stormwater capture, and recycling (MWD, 2024).
Phoenix and Tucson depend heavily on the 336-mile Central Arizona Project, which delivers Colorado River water to about 6 million people — 80% of Arizona's population — including Phoenix, Tucson, and many smaller cities (CAP, 2024).
Las Vegas draws ~90% of its supply from Lake Mead, which has dropped by approximately 160 feet since 2000 (Southern Nevada Water Authority, 2024). SNWA built an $817 million "Third Straw" intake (operational 2015) at lower elevation, and a $522 million Low Lake Level Pumping Station (operating since 2022) that can draw water below Hoover Dam's dead pool — meaning Las Vegas could keep drawing from Lake Mead even after downstream deliveries to California and Arizona are cut off.
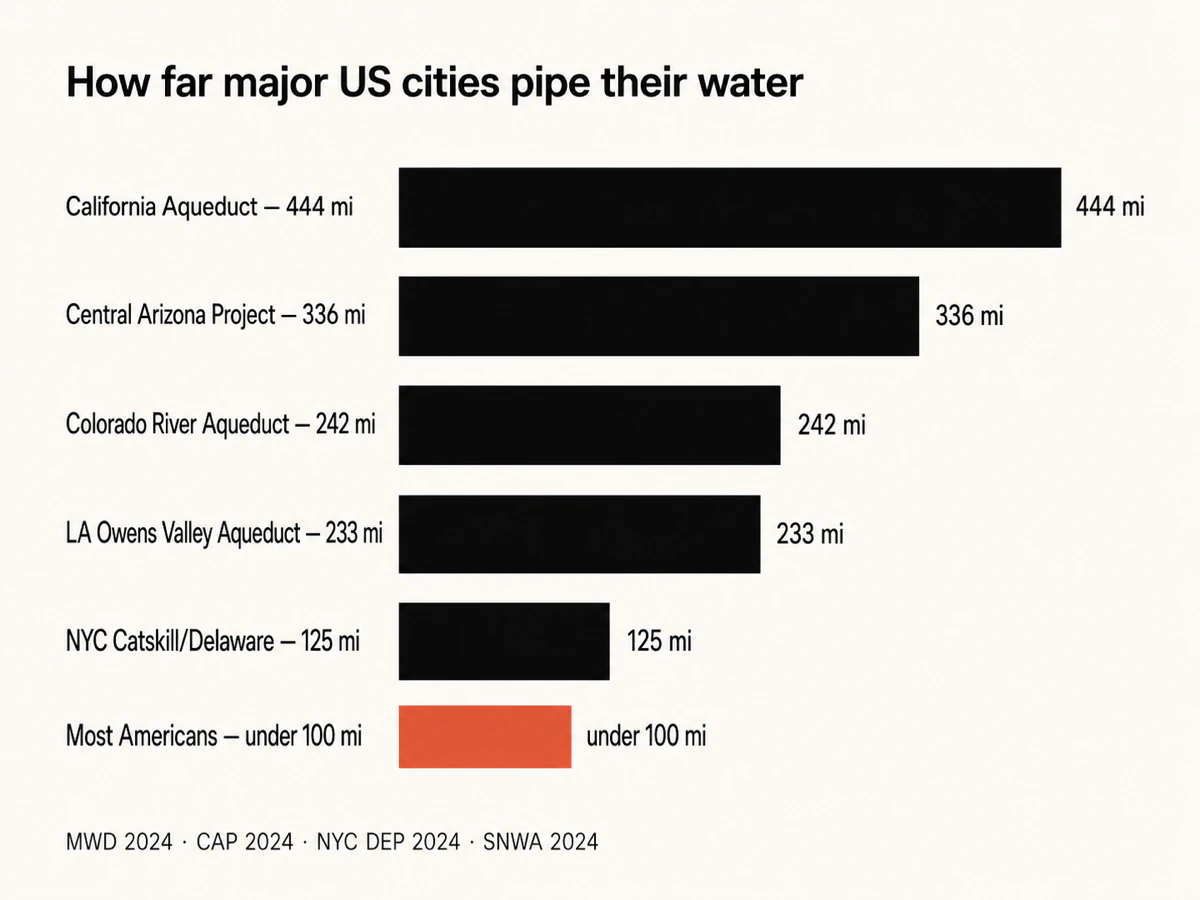
Most Americans, by contrast, drink water sourced within ~100 miles of home — from a regional river, a nearby lake, or a local aquifer.
Which aquifers serve the most people?
| Aquifer | Region | People served (drinking water) | Notable characteristics |
|---|---|---|---|
| Ogallala / High Plains Aquifer | Parts of 8 Great Plains states | ~2.3 million | Covers ~174,000 sq mi; 82% of those over it rely on it. Being depleted — saturated volume down ~9% since 1950; natural recharge would take ~6,000 years (USGS). |
| Floridan Aquifer System | FL, GA, AL, SC | ~10 million | Covers 100,000 sq mi. Primary source for Tallahassee, Jacksonville, Orlando, Tampa, Gainesville, and Savannah (USGS). |
| Biscayne Aquifer | South FL + Keys | ~3 million | Primary source for Miami-Dade, Broward, southern Palm Beach counties + Florida Keys. Shallow (often <50 ft), highly permeable limestone — uniquely vulnerable to surface contamination and saltwater intrusion (USGS). |
| Edwards Aquifer | Central TX | ~2 million | Karst limestone aquifer; sole drinking water source for most of San Antonio — making it the largest city in North America wholly dependent on groundwater. Edwards Aquifer Authority caps pumping permits (EAA, 2024). |
| Mountain West (Salt/Verde + CAP) | AZ | ~6 million via CAP | Phoenix half from Salt/Verde rivers, ~30% from Colorado River via CAP, balance groundwater. Tucson historically groundwater-only; now banks CAP water underground (CAP, 2024). |
| Cedar River / Tolt Watersheds | WA | 1.6 million | Seattle's protected unfiltered surface supply. 90,563 acres owned by the City of Seattle and closed to public access since the early 1900s (Seattle Public Utilities). |
| Quabbin/Wachusett (MWRA) | MA | 2.5 million | Boston metro + 53 MA communities. Quabbin = 412 billion gallon capacity, largest US reservoir built solely for water supply. Unfiltered surface supply (MWRA, 2024). |
| Hetch Hetchy | CA | 2.7 million | San Francisco + Bay Area. One of five major US cities allowed to deliver unfiltered surface water (SFPUC). |
| US average / national | — | — | 61% surface / 39% groundwater split by volume; ~100M Americans on public-supply wells, ~40M on private wells (USGS, 2015–2019). |
Sources: EPA SDWIS (2024), USGS Circular 1441 (2015), USGS Water Use program (2019), respective city utility data sheets (2024). See /our-data for row selection rules.
How does PFAS map onto US source water?
PFAS — the family of fluorinated "forever chemicals" that includes PFOA, PFOS, GenX, and PFBS — is now one of the most consequential contaminants in US drinking water. The USGS national tap-water study (Smalling et al., Environment International, 2023) sampled 716 sites and estimated that at least 45% of US tap water contains one or more PFAS compounds. Detection probability was ~75% in urban tap water and ~25% in rural.
Groundwater is not automatically cleaner. USGS's groundwater-specific work (McMahon et al., 2022) found PFAS in 60% of public-supply wells and 20% of private domestic wells sampled across five eastern aquifer systems. The most recent USGS national predictive model (Tokranov et al., Science, October 2024) concludes that approximately 71 to 95 million people in the Lower 48 states — more than 20% of the country's population — may rely on groundwater that contains detectable concentrations of PFAS for their drinking water (DOI: 10.1126/science.ado6638).
The EPA finalized enforceable Maximum Contaminant Levels (MCLs) for six PFAS compounds in April 2024 — 4 parts per trillion for PFOA and PFOS, 10 ppt for PFNA, PFHxS, and GenX, with a hazard index for mixtures. Utilities have until 2029 to comply. The MCLG (the health-based goal) for PFOA and PFOS is zero — meaning even the legally allowed 4 ppt is above what the EPA considers fully protective.
How does water travel from source to tap?
The journey is conceptually the same everywhere — and many of the contaminants that show up at your tap are added or accumulated between the source and your sink.
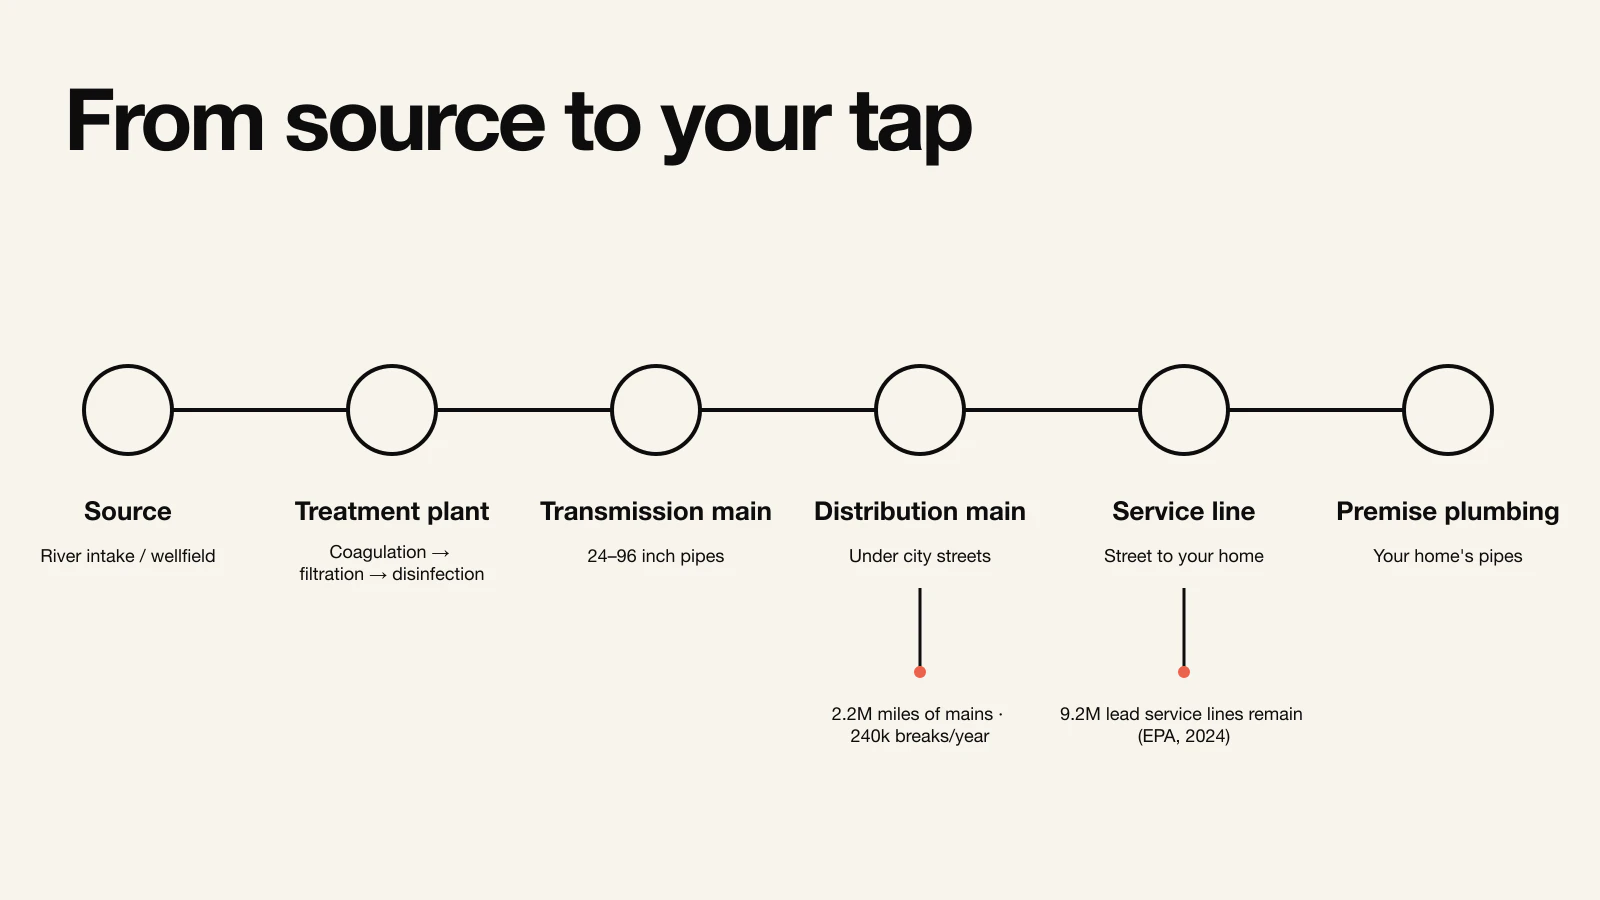
- Source — river intake, reservoir, lake crib, or wellfield.
- Treatment plant — typically coagulation, flocculation, sedimentation, filtration (sand or membrane), disinfection (chlorine, chloramine, ozone, or UV), and corrosion control (pH adjustment, orthophosphate). A handful of cities (NYC Catskill/Delaware, Seattle Cedar, Portland Bull Run, Boston Quabbin, San Francisco Hetch Hetchy) skip filtration under EPA waivers because their watersheds are exceptionally protected.
- Transmission mains — large-diameter pipes (often 24–96 inches) carrying treated water from the plant to distribution networks.
- Distribution mains — smaller pipes under city streets. The US has roughly 2.2 million miles of water mains (ASCE 2025 Infrastructure Report Card), 33% over 50 years old, with an estimated 240,000 water main breaks per year.
- Service line — the pipe from the street main to your home. There are an estimated 9.2 million lead service lines remaining in the US (EPA Lead and Copper Rule Improvements, 2024).
- Premise plumbing — your home's pipes, fittings, and water heater. Pre-1986 homes can have lead solder; corroded fixtures can leach copper or other metals.
"Water age" — the time elapsed between leaving the treatment plant and reaching your tap — matters because chlorine residual decays, disinfection byproducts form, and bacterial regrowth can occur. Homes near dead-end mains or in low-demand areas often have the highest TTHMs and the lowest disinfectant residual.
Two practical implications. First, your CCR measures water leaving the treatment plant or at sampling stations in the distribution system — not your specific tap. If you have lead service lines or older premise plumbing, the CCR can show "0 lead" while your actual tap reads higher. Second, the EPA Lead and Copper Rule Improvements (finalized 2024) require utilities to replace 10% of lead service lines per year, with most replacement complete within 10 years.
What does this mean for your decision?
Your drinking water source determines the contaminants you should be testing for and the filter category you actually need. A few scenarios:
- If you're on a surface-water system in a large city (Chicago, New York, Boston, Seattle, Portland): your headline risks are disinfection byproducts (TTHMs, HAA5), lead at the tap from pre-1986 plumbing or lead service lines, and seasonal taste/odor issues. NSF/ANSI 53 carbon block at the kitchen tap addresses most of these.
- If you're on a groundwater system in Florida or Texas (Miami, San Antonio, Orlando): naturally occurring radium, arsenic, manganese, and increasingly PFAS dominate. Standard activated carbon won't address these — NSF 58 reverse osmosis is the appropriate technology.
- If you're on the Colorado River system (Las Vegas, Phoenix, Tucson, parts of LA): hardness, salinity, and trace pharmaceuticals from upstream wastewater are the recurring concerns. The 2024 PFAS rule applies; check your CCR.
- If you're on a private well anywhere: an annual test for total coliform and nitrate is the floor; a one-time baseline panel for arsenic, lead, manganese, radon, uranium, fluoride, and (regionally) PFAS or VOCs is the appropriate first step.
Methodology and disclosure
This guide draws on EPA SDWIS (the federal Safe Drinking Water Information System), USGS Circular 1441 (the 2015 national water-use estimates), USGS national PFAS work (Smalling et al., 2023; McMahon et al., 2022; Tokranov et al., 2024), the EPA Lead and Copper Rule Improvements (2024), the ASCE 2025 Infrastructure Report Card, and our database of 18,774 community water system Consumer Confidence Reports. Per-row source citations are included in the comparison table.
TapWaterData earns affiliate commission on filters recommended in our Filter Buyer guides. This guide contains no affiliate links. Our methodology — including how we aggregate CCR data, how filters are scored, and how the row selection for our comparison tables is made — is published at /our-data.