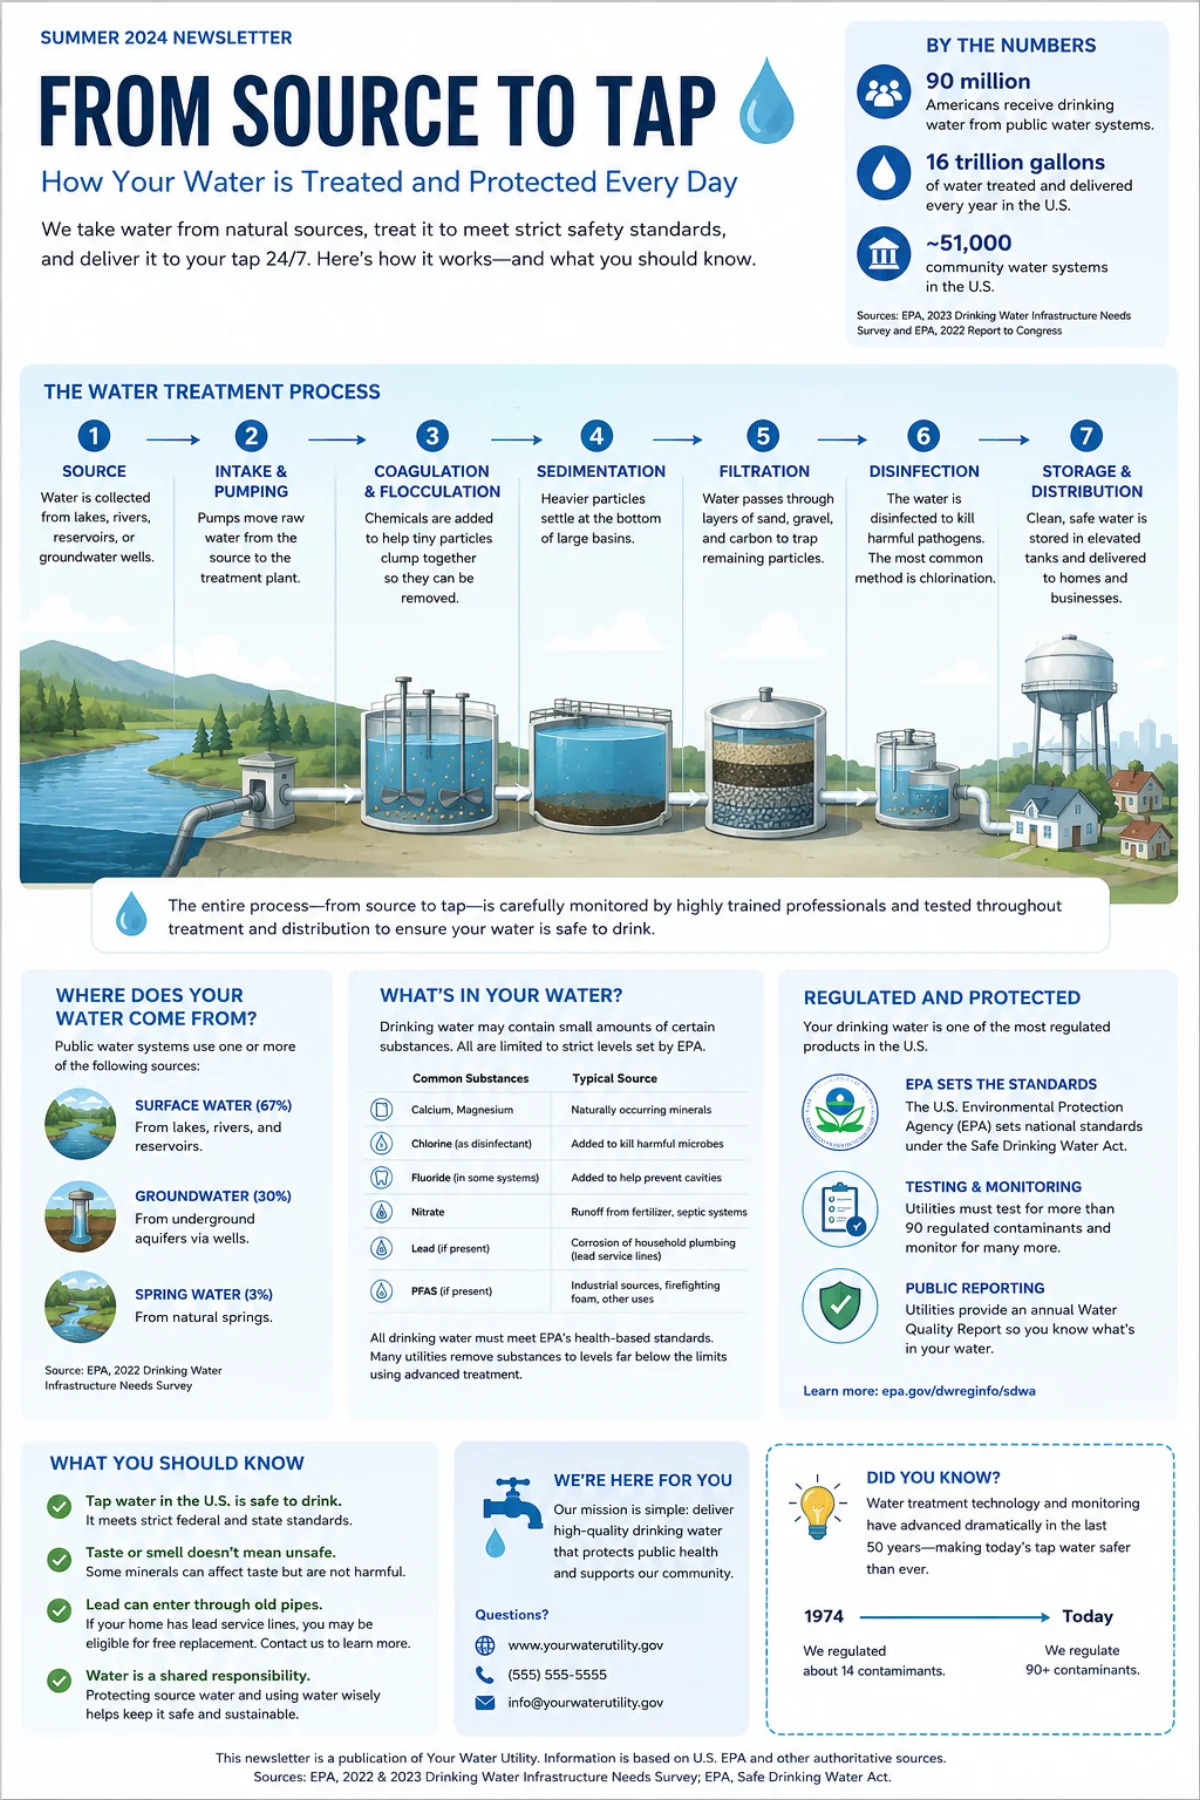
When you turn on the tap, the water treatment process that delivered that glass is already complete. Most U.S. drinking water has traveled from a river, lake, reservoir, or underground aquifer, through a treatment plant, into storage tanks, down miles of pipes, and through your home's plumbing — all before it hits your faucet. The Safe Drinking Water Act gives the EPA authority to set enforceable national standards for more than 90 contaminants, and roughly 50,000 community water systems carry out the daily work of meeting them.
This guide walks through where tap water comes from, the 7 steps a typical treatment plant uses, what can legitimately be in your water, who regulates it, and the four things every household should check in their own Consumer Confidence Report. The numbers throughout are sourced from EPA, USGS, and CDC primary documents — every claim is footnoted at the bottom.
✅ The 60-second version:
- U.S. tap water usually comes from surface water (rivers, lakes, reservoirs — about 61% of public supply) or groundwater (aquifers — about 39%). Some utilities blend, buy, or use desalinated/recycled water.
- A typical surface-water plant uses 7 steps: intake → coagulation → flocculation → sedimentation → filtration → disinfection → pH/corrosion control → storage and distribution.
- The EPA regulates more than 90 contaminants under the Safe Drinking Water Act. States or tribes enforce the rules with "primacy" delegated by EPA.
- Lead is usually a plumbing problem, not a treatment-plant problem — it enters water from old service lines and household fixtures after the plant.
- PFAS rules are evolving — EPA finalized the first national PFAS standards in 2024 and is reconsidering compliance timing for some PFAS as of 2025.
- Your annual Consumer Confidence Report (CCR) is the single best starting point for understanding what's in your water. Most utilities publish it by July 1 each year.
🌊 Where Does U.S. Tap Water Come From?
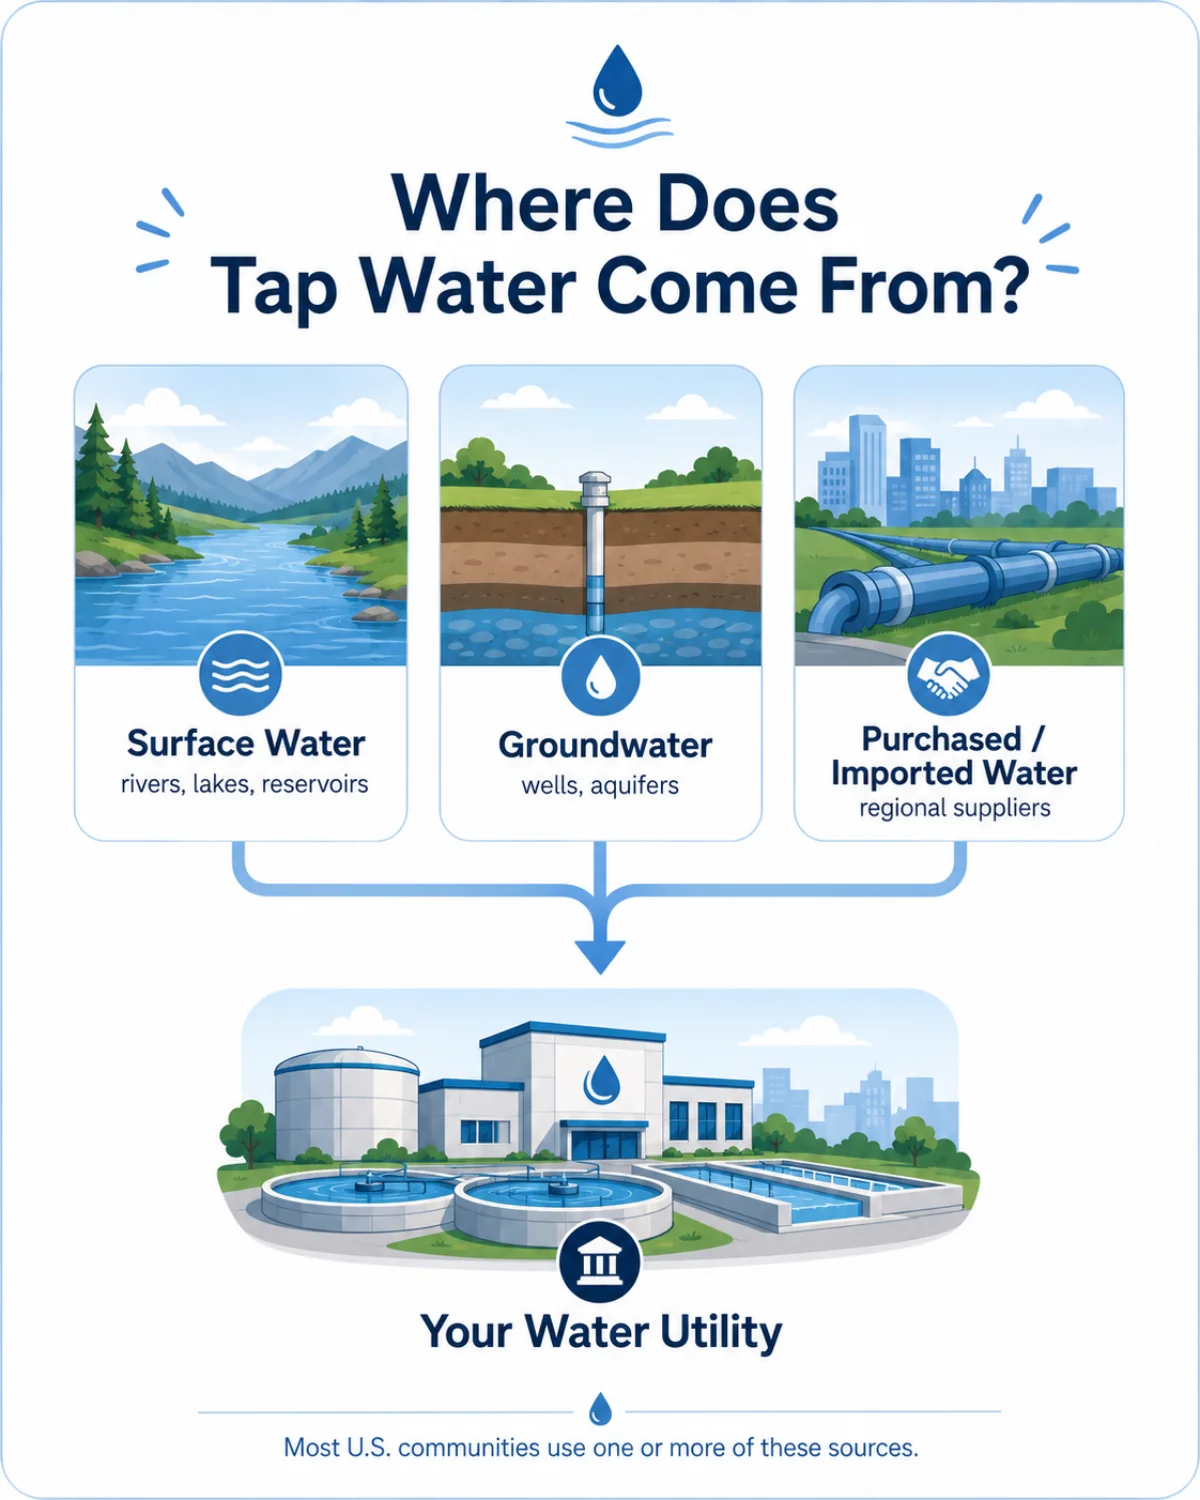
Tap water does not start as drinking water. It starts as raw water that a utility is responsible for turning into something that meets federal and state safety standards. Most public water systems draw from one of four kinds of sources.
Surface water — rivers, lakes, and reservoirs
Surface water is exposed to almost everything that happens upstream: runoff after storms, wildlife, soil and sediment, algae blooms, wastewater discharges, and agricultural or industrial activity. Because that exposure is constant, surface-water utilities almost always run the full multi-step treatment chain — especially coagulation, filtration, and disinfection. According to the USGS, U.S. public-supply systems withdrew about 23,800 million gallons per day of surface water in 2015 — the most recent comprehensive USGS estimate for public supply. That works out to roughly 61% of public-supply withdrawals.
Groundwater — aquifers and wells
Groundwater is naturally filtered as it moves through soil, sand, and rock, which is why some small utilities can get away with simpler treatment. But "natural filtration" doesn't catch dissolved chemistry. Depending on local geology and land use, groundwater can carry arsenic, nitrate, uranium, iron, manganese, hardness minerals, industrial solvents, or PFAS. The same 2015 USGS dataset reports about 15,200 million gallons per day of groundwater withdrawals for public supply — the other ~39%.
Purchased or imported water
Many large metro areas — especially in dry regions — buy treated water wholesale from a regional supplier and add their own corrosion control, disinfectant residual, or blending before distribution. If you live in Southern California, parts of Texas, or much of the Front Range, your water likely passes through more than one system before it reaches you.
Desalinated or advanced-recycled water
In coastal or water-stressed communities, some utilities rely on desalinated seawater or advanced purified recycled water. These systems typically use membrane filtration, reverse osmosis, advanced oxidation, and tighter monitoring than the average surface-water plant.
ℹ️ A useful framing: source water → treatment plant → storage and pipes → your tap → your home plumbing and filter choices. Each step has its own risks and its own controls. A failure at any one of them is what shows up in news headlines. :::
⚙️ How a Water Treatment Plant Works (The 7 Steps)
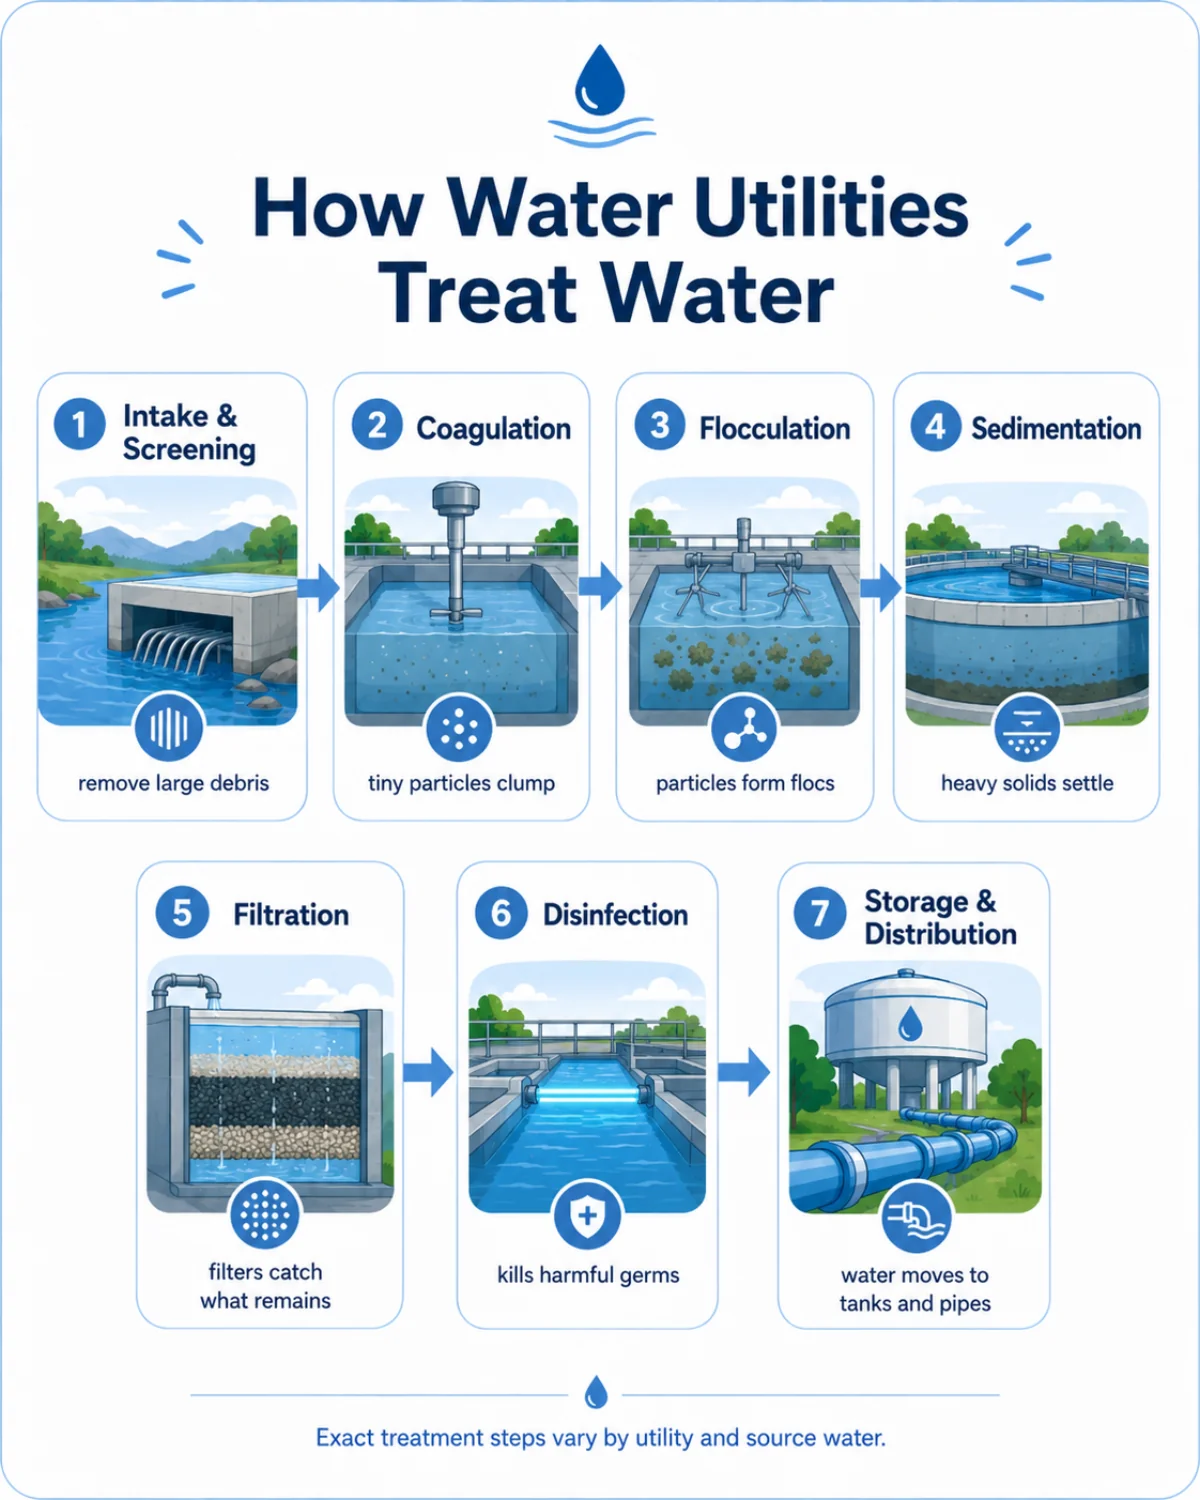
Not every plant looks the same. A small groundwater system in a rural town may skip several stages; a large surface-water plant serving a major city may run all of them in parallel. The CDC's overview of how water treatment works describes the same general sequence used at most U.S. surface-water plants.
Step 1 — Intake and screening
Water is pulled from a river, lake, reservoir, or well. Mechanical screens stop large debris — leaves, branches, fish, trash. Operators continuously test raw-water conditions: turbidity, temperature, pH, algae counts, and sometimes taste-and-odor compounds that signal an upstream problem.
Plain-English version: keep the big stuff out and watch for surprises.
Step 2 — Coagulation
Most particles in water are too small and too negatively charged to settle on their own. Utilities add coagulants — usually aluminum sulfate (alum) or iron salts — to neutralize the charge so particles start to clump.
Plain-English version: chemistry that makes invisible particles want to stick together.
Step 3 — Flocculation
The water is slowly stirred so the small clumps grow into larger ones — called floc. The slower the mix, the bigger and heavier the floc gets.
Plain-English version: tiny particles become "snowflakes" in the water.
Step 4 — Sedimentation
The water sits in large basins. The heavier floc sinks. Cleaner water on top flows to the next stage.
Plain-English version: the heavy stuff drops out.
Step 5 — Filtration
The clearer water from sedimentation is pushed through filters — typically layered sand, gravel, anthracite coal, and sometimes granular activated carbon. Some plants use membrane filtration (microfiltration or ultrafiltration). Filters catch the particles, microbes, and organic matter that survived sedimentation. Low turbidity (cloudiness) is the key real-time signal that filtration is working.
Plain-English version: the polish step before disinfection.
Step 6 — Disinfection
Utilities add a disinfectant — chlorine, chloramine, ozone, ultraviolet light, or some combination — to inactivate disease-causing organisms. Most systems also keep a small disinfectant residual in the distribution system so the water stays protected on the way to homes. The EPA's maximum residual disinfectant levels (MRDLs) cap chlorine and chloramines at 4.0 mg/L as Cl₂ and chlorine dioxide at 0.8 mg/L.
Plain-English version: kill the germs, and keep killing them all the way to your tap.
Step 7 — pH, corrosion control, and final conditioning
Before distribution, utilities adjust the chemistry of the finished water. That usually includes pH and alkalinity adjustment to reduce pipe corrosion, an inhibitor like orthophosphate that coats the inside of lead-containing pipes, and (where local policy applies) fluoride adjustment. Some plants also do final treatment for hardness, iron and manganese, arsenic, nitrate, or PFAS depending on their source water.
Plain-English version: safe water isn't only about removing contaminants — utilities also manage the chemistry so the water behaves safely in pipes.
Step 8 — Storage and distribution
Treated water moves into storage tanks and out through miles of distribution pipes to homes and businesses. This stage is easy to overlook, but it is where many of the headline failures happen — water main breaks, pressure loss, dead-end pipes, biofilm, and corroding service lines can all degrade quality after the plant has done its job.
Plain-English version: water has to stay safe all the way from the plant to your faucet.
💡 Why the order matters. Each step makes the next one possible. Coagulation and flocculation reduce the load on sedimentation. Sedimentation and filtration reduce the load on disinfection — and lower turbidity makes disinfection dramatically more effective. Skip a step and the rest of the chain works harder, less reliably, and at higher chemical doses. :::
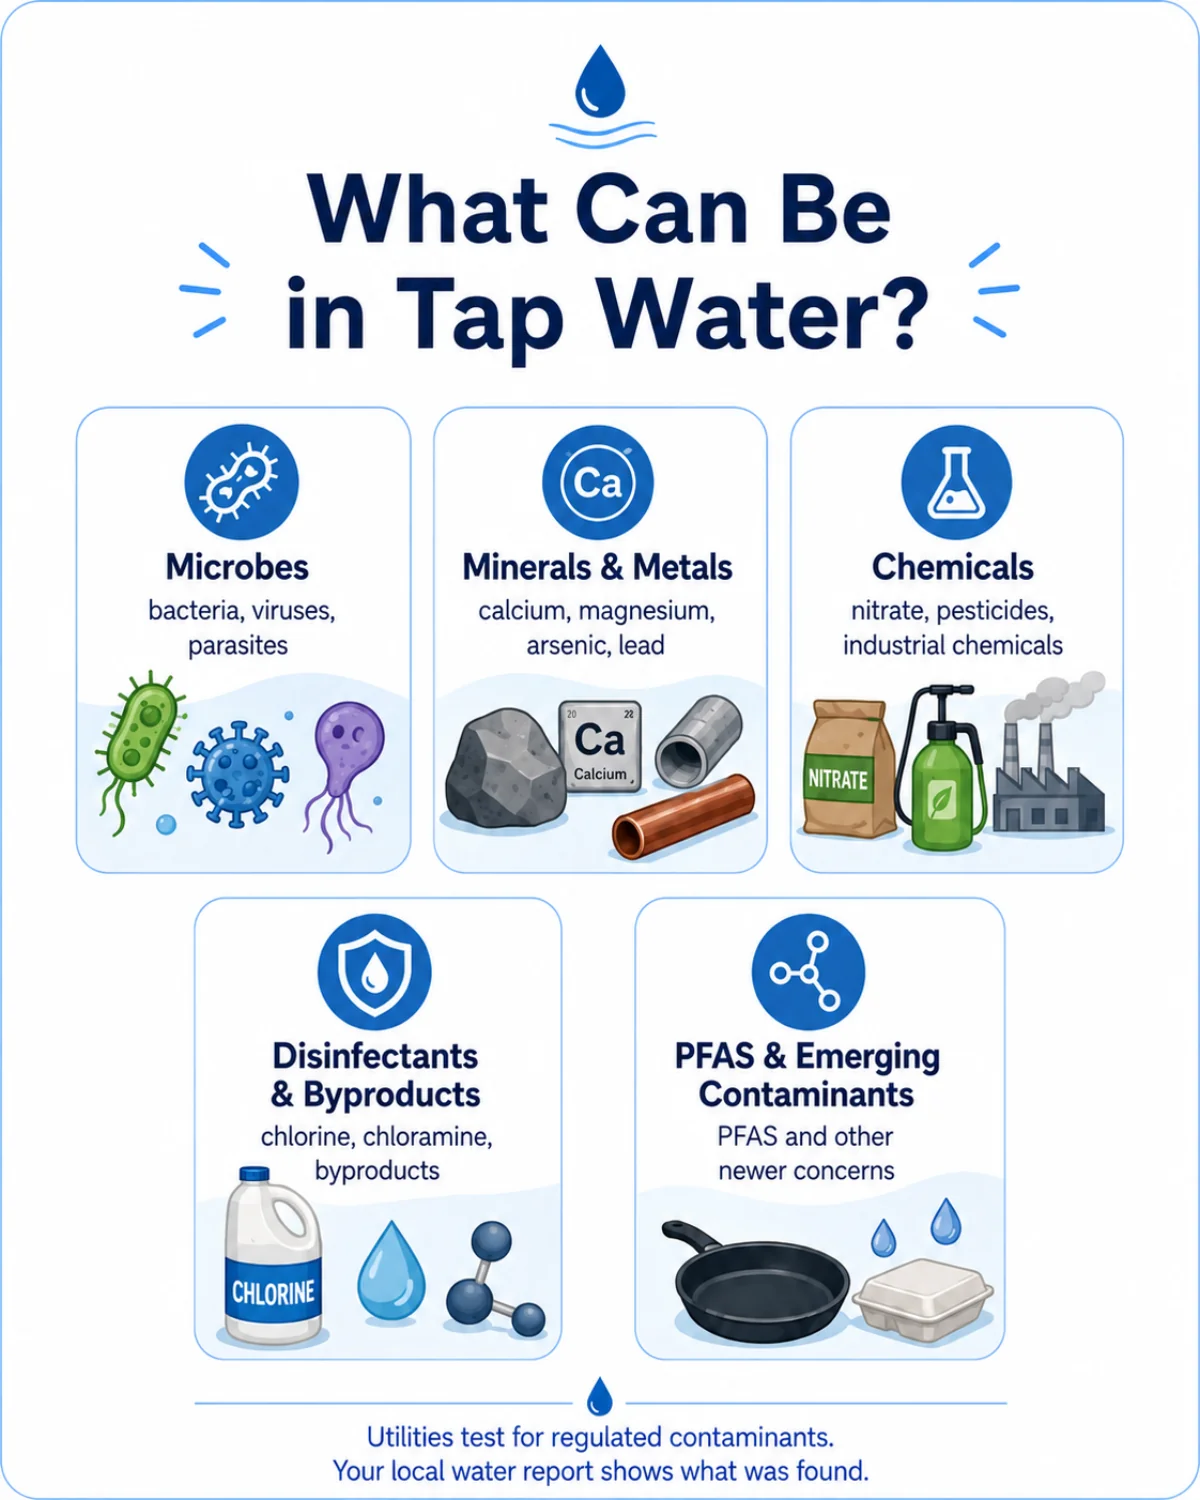
🧪 What Can Be in Tap Water?
"Contaminant" doesn't automatically mean "dangerous at any level." Under the Safe Drinking Water Act, a contaminant is any physical, chemical, biological, or radiological substance in water — some are naturally occurring, some are added on purpose for treatment, and some come from human activity. Risk depends on the contaminant, the concentration, how long someone is exposed, and the health status of the person drinking it. The CCR jargon for this distinction is detection vs. violation — most detected contaminants are well below health-based limits.
There are seven categories worth understanding.
1. Microbes
Bacteria, viruses, Giardia, Cryptosporidium, Legionella, and E. coli indicators. This is the category that causes acute illness — boil-water notices and outbreaks. Filtration, disinfection, distribution-system pressure, and disinfectant residual all exist to control it.
2. Particles and turbidity
Turbidity measures cloudiness. High turbidity interferes with disinfection and may signal that more particles or microbes are present. The EPA's Surface Water Treatment Rules require utilities to keep turbidity below specific limits at filtered systems.
3. Inorganic chemicals and minerals
Arsenic, nitrate, nitrite, fluoride, chromium, selenium, barium, copper, lead, mercury, uranium. These come from natural rock and soil, fertilizers, septic systems, mining, industry, plumbing corrosion, or treatment additives. Three to know:
- Arsenic is naturally elevated in groundwater across parts of the western U.S., New England, and the upper Midwest. EPA's MCL is 10 parts per billion, or 0.010 mg/L.
- Nitrate mainly comes from fertilizer runoff, septic systems, and natural deposits. The EPA MCL is 10 mg/L as nitrogen. Nitrate is one of the few contaminants where infants under 6 months face acute risk, not chronic.
- Lead is overwhelmingly a plumbing problem. Treatment plants remove very little lead because the source is almost always downstream of the plant — old lead service lines, brass fixtures, or solder. The 2021 Lead and Copper Rule Revisions and 2024 Lead and Copper Rule Improvements tighten action levels and require lead-service-line replacement.
4. Organic chemicals
Pesticides, herbicides, solvents, fuel additives, industrial chemicals, and legacy contaminants like trichloroethylene. They get into source water from agriculture, industry, landfills, leaking storage tanks, or historical contamination plumes.
5. Disinfectants and disinfection byproducts (DBPs)
Disinfectants are added on purpose; they protect against acute microbial risk. But when disinfectants react with natural organic matter in source water, they can form trihalomethanes (TTHMs) and haloacetic acids (HAA5). The EPA's Stage 2 Disinfectants and Disinfection Byproducts Rule sets MCLs at 80 µg/L (0.080 mg/L) for TTHMs and 60 µg/L (0.060 mg/L) for HAA5.
This is one of the central tradeoffs of water treatment: enough disinfectant to control germs, but not so much that byproducts climb past their limits.
6. PFAS and emerging contaminants
PFAS — per- and polyfluoroalkyl substances — are a family of thousands of persistent synthetic chemicals nicknamed "forever chemicals." They enter source water from industrial sites, firefighting foam, landfills, and consumer-product supply chains.
EPA finalized the first national PFAS drinking-water standards in April 2024, setting MCLs of 4 parts per trillion (ng/L) for PFOA and PFOS and additional limits for PFHxS, PFNA, GenX (HFPO-DA), and a hazard-index approach for mixtures. As of 2025, EPA has announced its intent to extend compliance timing for PFOA and PFOS to 2031 and to reconsider regulation of the other four PFAS — the 4-ppt MCLs themselves remain in force. Rules in this area are still moving; always check the date of any PFAS guidance.
The EPA's Draft Contaminant Candidate List 6 (CCL 6), published in 2025, names additional substances under evaluation for possible future regulation — including microplastics, pharmaceuticals, certain PFAS, and disinfection byproducts. Being on the candidate list does not yet mean an enforceable limit.
7. Aesthetic issues
Hardness, iron, manganese, sulfur smell, chlorine taste, earthy/musty odor, color, and total dissolved solids. These are governed by the EPA's non-enforceable Secondary Drinking Water Standards — they affect taste, smell, appearance, and appliance scaling rather than acute health risk.
🏛️ Who Regulates U.S. Drinking Water?
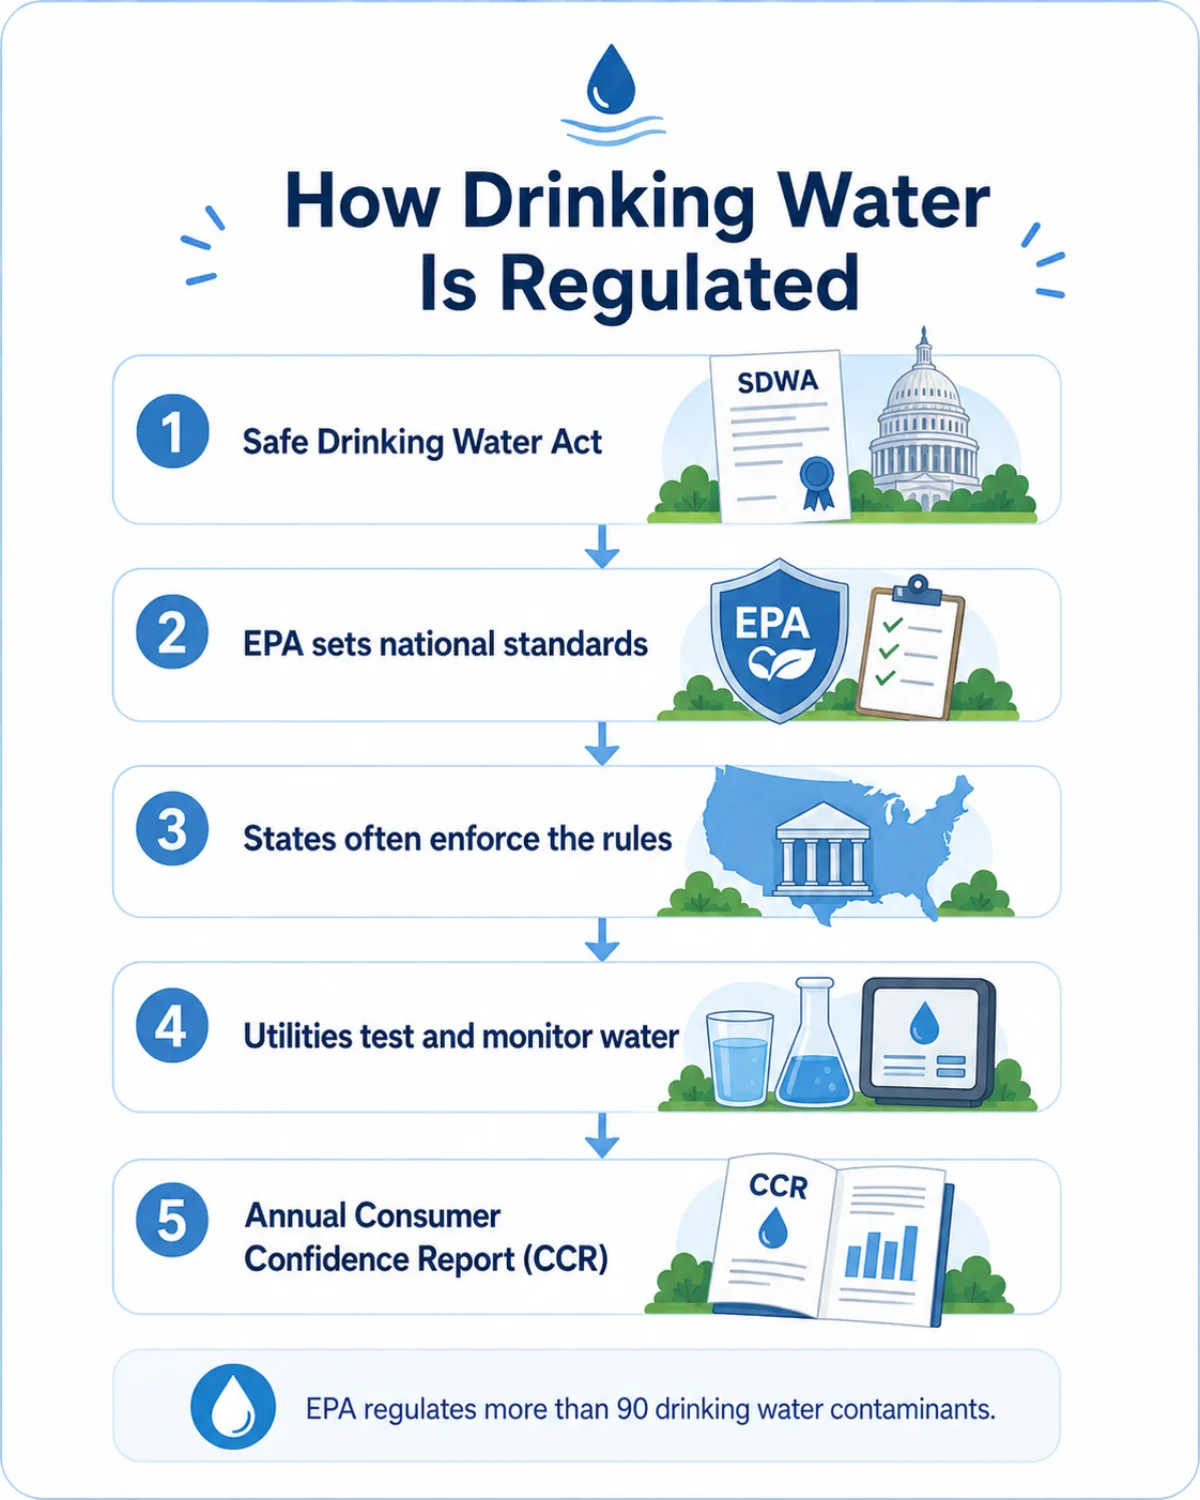
The backbone of U.S. drinking-water law is the Safe Drinking Water Act (SDWA), originally passed in 1974 and amended in 1986 and 1996. Under the SDWA:
- The EPA sets the National Primary Drinking Water Regulations (NPDWRs) — legally enforceable, health-based standards for more than 90 contaminants.
- States and tribes can apply for "primacy" — primary enforcement authority — and most do. Your state or tribal drinking-water program is the one actually inspecting your utility and acting on violations.
- Utilities monitor water quality, report results, comply with treatment requirements, and notify customers when something goes wrong.
The regulatory toolkit has four types of standard you'll see in your CCR:
Maximum Contaminant Level (MCL)
The highest legally allowed level of a contaminant in finished drinking water. Examples published by the EPA:
| Contaminant | MCL |
|---|---|
| Arsenic | 0.010 mg/L (10 ppb) |
| Nitrate (as N) | 10 mg/L |
| Total trihalomethanes (TTHMs) | 0.080 mg/L (80 ppb) |
| Haloacetic acids (HAA5) | 0.060 mg/L (60 ppb) |
| PFOA | 4.0 ng/L (4 ppt) |
| PFOS | 4.0 ng/L (4 ppt) |
| Copper (action level) | 1.3 mg/L (90th percentile) |
| Lead (action level) | 15 µg/L (15 ppb, 90th percentile — dropping to 10 ppb under 2024 LCRI in 2027) |
Treatment Technique (TT)
When measurement isn't reliable or economic, EPA requires a treatment process instead of a numeric limit. Lead is the canonical example — utilities must run corrosion control, sample taps, notify the public when action levels are exceeded, and replace lead service lines under the 2024 Lead and Copper Rule Improvements.
Maximum Residual Disinfectant Level (MRDL)
These apply to the disinfectants added to control microbes:
- Chlorine: 4.0 mg/L as Cl₂
- Chloramines: 4.0 mg/L as Cl₂
- Chlorine dioxide: 0.8 mg/L
Secondary Drinking Water Standards
Non-enforceable federal guidelines for aesthetics — taste, odor, color, hardness, staining, total dissolved solids. They are guidance, not law.
📄 What Your Annual Water Quality Report Tells You
Every community water system in the U.S. must produce a Consumer Confidence Report (CCR) — also called the annual water quality report — and provide it to customers, usually by July 1 each year. The EPA's CCR rule sets the format and content. We have a separate, step-by-step walkthrough at how to read your CCR.
A CCR can answer:
- Where does my water come from?
- What contaminants were detected, and at what levels?
- Were any detected levels above legal limits?
- What disinfectant does my utility use?
- Did my system have any violations?
- Are there special warnings for infants, pregnant people, the immunocompromised, or older adults?
- Does my utility mention PFAS, lead service lines, nitrate, arsenic, or disinfection byproducts?
The most useful mental rule: detection ≠ unsafe. Many regulated substances will be present below EPA limits — that's normal and lawful. Pay closer attention if you see a value near or above a limit, if you're in a sensitive group, or if your utility mentions a violation or a service-line problem.
🧱 What Treatment Can and Cannot Do
Treatment is powerful, but it is not magic.
Plants generally do well at:
- Removing particles and reducing turbidity
- Inactivating microbes through filtration plus disinfection
- Adjusting chemistry to control pipe corrosion
- Removing or reducing specific contaminants the plant is designed for
- Monitoring regulated contaminants and reporting violations
Plants struggle with — or need add-on systems for:
- PFAS, which usually requires granular activated carbon, ion exchange, or reverse osmosis
- Nitrate in groundwater, which may need ion exchange, RO, biological denitrification, or blending
- Arsenic in groundwater, which may need oxidation, adsorption, or specialized coagulation
- Lead from service lines or household plumbing, because the source is downstream of the plant
- Taste and odor compounds from algae or natural organic matter, which may need activated carbon, ozone, or source-water management
This is why the conversation about home filters matters even in cities with excellent treatment plants — they are responsible for what they deliver to the curb, not for what happens after.
🏠 What Homeowners Should Check
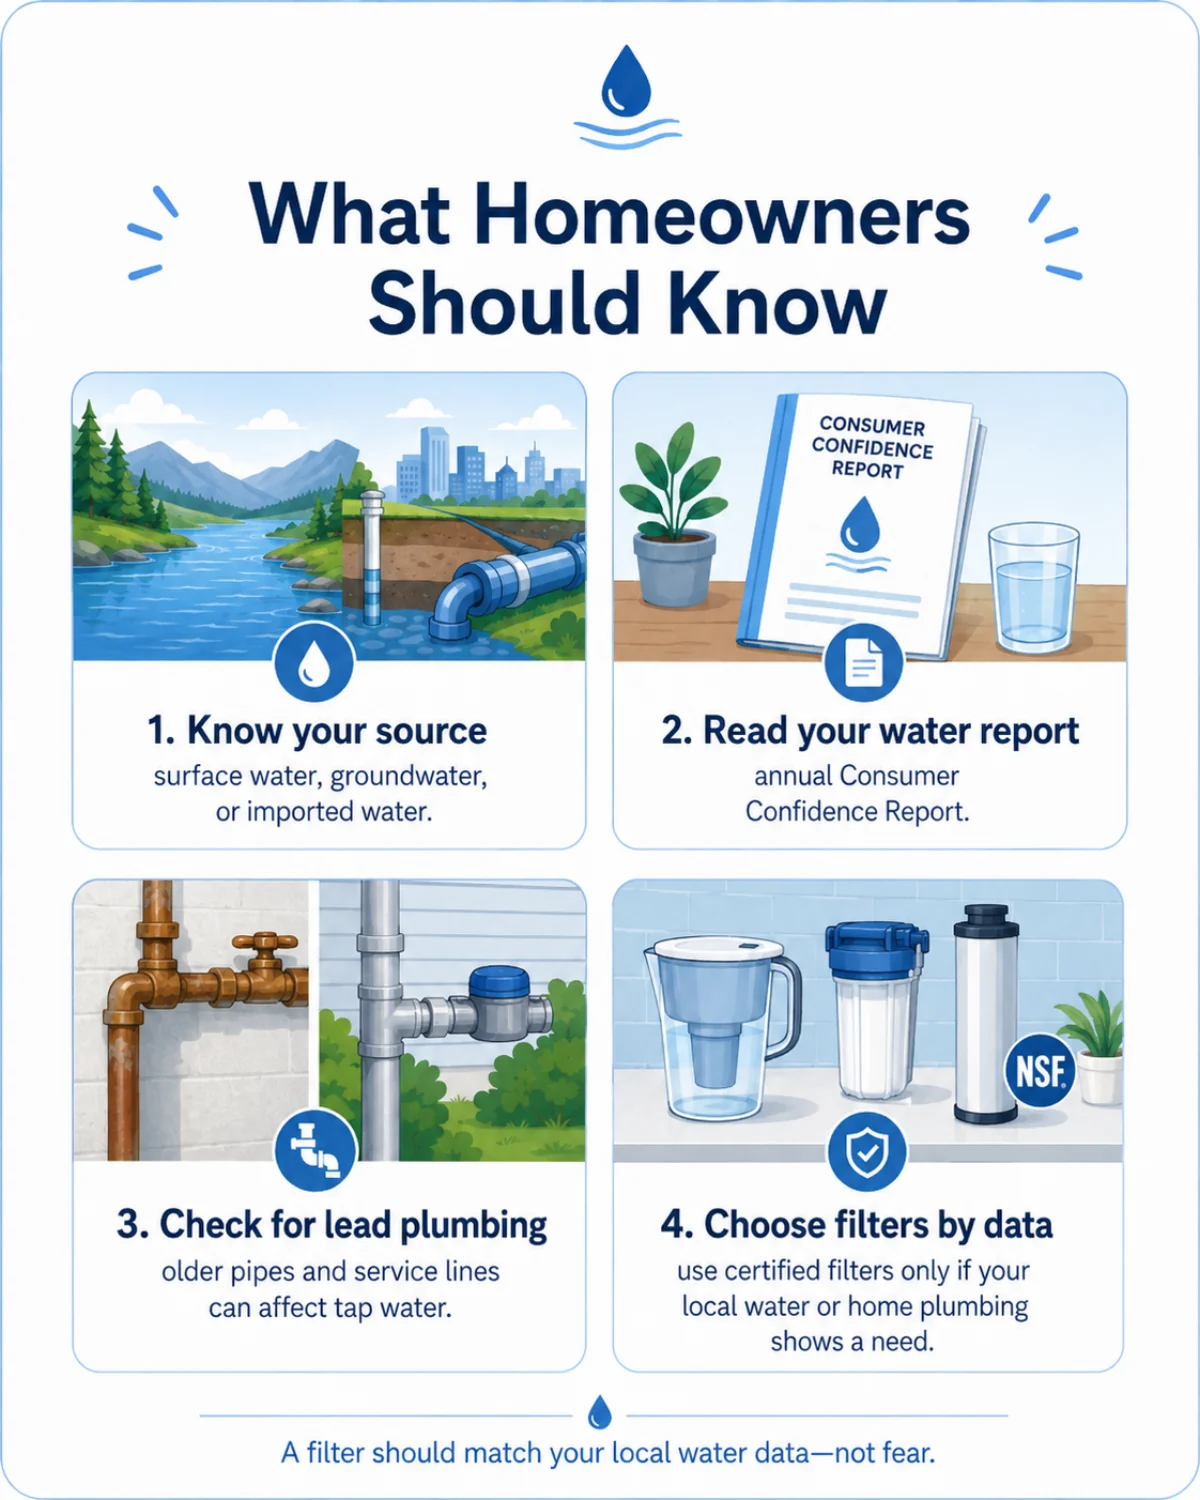
If you do nothing else with this guide, do these four things.
1. Know your source
Pull your most recent CCR. It will say whether your water is surface, groundwater, purchased, blended, or some mix — and from which named reservoir, river, well field, or wholesale supplier. Source determines which contaminants are even plausible.
2. Read your annual water report
Spend 15 minutes with your CCR. Look at every detected contaminant. Compare the detected number to the MCL. Flag anything near or above the limit. Note any violations the utility had to disclose. Our step-by-step CCR walkthrough decodes the abbreviations.
3. Check for lead in your plumbing
The 2024 Lead and Copper Rule Improvements require utilities to publish a public service-line inventory identifying which homes are served by lead, galvanized requiring replacement, or unknown-material lines. Find your address in your utility's inventory. If your line is lead or unknown, request a lead test of your tap water from the utility or use an EPA-certified lab.
4. Choose filters by data, not fear
A filter is a personal risk-management tool, not a replacement for the public system. Match a certified filter to a specific contaminant your data shows — using NSF/ANSI standards that name the contaminant on the certification (e.g., NSF/ANSI 53 for lead, NSF/ANSI 58 for PFAS reduction by RO). A generic "water purifier" claim with no certification is marketing, not engineering.
💡 Look up your city. TapWaterData ingests EPA SDWIS, the Fifth Unregulated Contaminant Monitoring Rule (UCMR 5), and locally published CCRs for 18,000+ U.S. cities. Check your city's water quality → :::
📋 One-Minute Summary
- U.S. tap water usually comes from surface water, groundwater, purchased/imported water, or a blend.
- Surface-water plants typically run a 7-step chain: intake → coagulation → flocculation → sedimentation → filtration → disinfection → pH/corrosion control → distribution.
- Groundwater systems may use simpler treatment, but groundwater can carry arsenic, nitrate, uranium, iron, or PFAS depending on local geology.
- Disinfection prevents waterborne disease, but utilities have to balance it against disinfection byproducts like TTHMs and HAA5.
- Lead is overwhelmingly a plumbing-and-service-line problem, not a treatment-plant problem.
- PFAS rules are evolving — EPA's 4-ppt MCLs for PFOA and PFOS remain in force, but compliance timing for those two is being extended and rules for some other PFAS are being reconsidered as of 2025.
- Your annual Consumer Confidence Report is the single best starting point for understanding your local water.
- Home filters should be chosen based on your actual water data and on NSF/ANSI certifications that name the contaminant you're targeting.
✅ Take the next 15 minutes:
- Find your CCR (your utility's website or look up your city).
- Note the source(s), the disinfectant, and any flagged contaminants.
- Check whether your service line is on the utility's public lead inventory.
- If anything looks off, match a certified filter to the specific contaminant.
Bookmark this page and re-run the same check next July when the new CCR arrives.
📚 Sources
Every number and rule above is drawn from primary U.S. government sources:
- U.S. EPA — Safe Drinking Water Act overview
- U.S. EPA — National Primary Drinking Water Regulations
- U.S. EPA — How EPA regulates drinking water contaminants
- U.S. EPA — Consumer Confidence Report Rule
- U.S. EPA — Lead and Copper Rule Improvements (2024)
- U.S. EPA — PFAS National Primary Drinking Water Regulation (2024)
- U.S. EPA — Stage 2 Disinfectants and Disinfection Byproducts Rule
- U.S. EPA — Secondary Drinking Water Standards
- U.S. EPA — Contaminant Candidate List 6 (Draft)
- U.S. CDC — How Water Treatment Works
- U.S. Geological Survey — Public Supply Water Use